
Page 29 - Introduction to Paleobiology and The Fossil Record
P. 29
16 INTRODUCTION TO PALEOBIOLOGY AND THE FOSSIL RECORD
30
25
20
L
Frequency 15
10
W
5
0
0 5 10 15 20 25 30
Length (mm)
(a)
80
70
60
Cumulative frequency 40
50
30
20
10
0
0 5 10 15 20 25 30
Length (mm)
(b)
20
+
+
15 + +
+
+
+ + + +
+ +
+
Maximum width (mm) 10 5 + + + + + + + + ++
+
+
+
+
+
+ + +
+ + ++ + + + + + + + + + +
0
0 5 10 15 20 25
Sagittal length (mm)
(c)
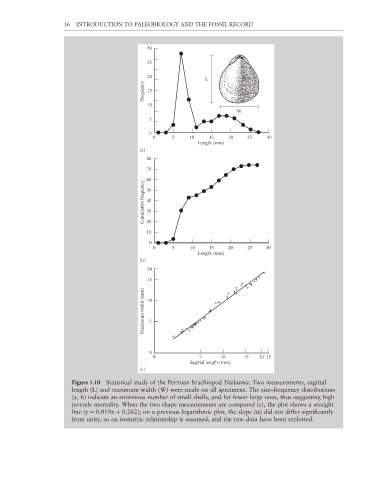
Figure 1.10 Statistical study of the Permian brachiopod Dielasma. Two measurements, sagittal
length (L) and maximum width (W) were made on all specimens. The size–frequency distributions
(a, b) indicate an enormous number of small shells, and far fewer large ones, thus suggesting high
juvenile mortality. When the two shape measurements are compared (c), the plot shows a straight
line (y = 0.819x + 0.262); on a previous logarithmic plot, the slope (α) did not differ signifi cantly
from unity, so an isometric relationship is assumed, and the raw data have been replotted.