
Page 30 - Introduction to Paleobiology and The Fossil Record
P. 30
PALEONTOLOGY AS A SCIENCE 17
Animal groups represented
Taphonomic classes: bone shapes
fishes
rounded
amphibians subangular
turtles
lizards, etc.
crocodiles
pterosaurs
dinosaurs
mammal-like reptiles subrounded
mammals
(a) (c)
Bone types
12
limb elements
vertebrae and ribs 10 A
skull and jaw 8
Frequency 6 4 B
elements teeth
dermal armor 2
0
fish scales
0.2 0.3 0.4 0.5
(b) Ratio L/W
(d)
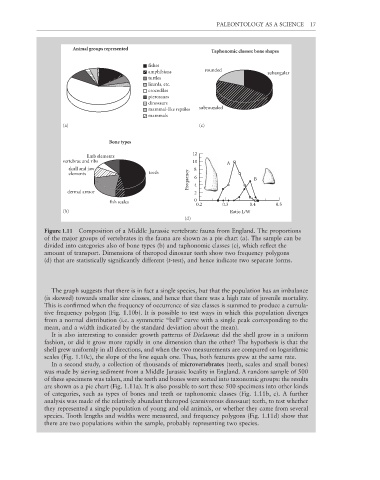
Figure 1.11 Composition of a Middle Jurassic vertebrate fauna from England. The proportions
of the major groups of vertebrates in the fauna are shown as a pie chart (a). The sample can be
divided into categories also of bone types (b) and taphonomic classes (c), which refl ect the
amount of transport. Dimensions of theropod dinosaur teeth show two frequency polygons
(d) that are statistically signifi cantly different (t-test), and hence indicate two separate forms.
The graph suggests that there is in fact a single species, but that the population has an imbalance
(is skewed) towards smaller size classes, and hence that there was a high rate of juvenile mortality.
This is confirmed when the frequency of occurrence of size classes is summed to produce a cumula-
tive frequency polygon (Fig. 1.10b). It is possible to test ways in which this population diverges
from a normal distribution (i.e. a symmetric “bell” curve with a single peak corresponding to the
mean, and a width indicated by the standard deviation about the mean).
It is also interesting to consider growth patterns of Dielasma: did the shell grow in a uniform
fashion, or did it grow more rapidly in one dimension than the other? The hypothesis is that the
shell grew uniformly in all directions, and when the two measurements are compared on logarithmic
scales (Fig. 1.10c), the slope of the line equals one. Thus, both features grew at the same rate.
In a second study, a collection of thousands of microvertebrates (teeth, scales and small bones)
was made by sieving sediment from a Middle Jurassic locality in England. A random sample of 500
of these specimens was taken, and the teeth and bones were sorted into taxonomic groups: the results
are shown as a pie chart (Fig. 1.11a). It is also possible to sort these 500 specimens into other kinds
of categories, such as types of bones and teeth or taphonomic classes (Fig. 1.11b, c). A further
analysis was made of the relatively abundant theropod (carnivorous dinosaur) teeth, to test whether
they represented a single population of young and old animals, or whether they came from several
species. Tooth lengths and widths were measured, and frequency polygons (Fig. 1.11d) show that
there are two populations within the sample, probably representing two species.