
Page 183 - Introduction to Petroleum Engineering
P. 183
170 WELL LOGGING
Porosity
0.30 0.20 0.10 0.00
4000
4010
Cross-
over 4020
Depth (ft) Neutron
Density
4030
4040
4050
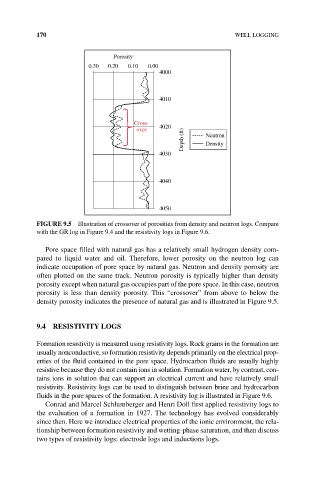
FIGuRE 9.5 Illustration of crossover of porosities from density and neutron logs. Compare
with the GR log in Figure 9.4 and the resistivity logs in Figure 9.6.
Pore space filled with natural gas has a relatively small hydrogen density com-
pared to liquid water and oil. Therefore, lower porosity on the neutron log can
indicate occupation of pore space by natural gas. Neutron and density porosity are
often plotted on the same track. Neutron porosity is typically higher than density
porosity except when natural gas occupies part of the pore space. In this case, neutron
porosity is less than density porosity. This “crossover” from above to below the
density porosity indicates the presence of natural gas and is illustrated in Figure 9.5.
9.4 RESISTIVITY LOGS
Formation resistivity is measured using resistivity logs. Rock grains in the formation are
usually nonconductive, so formation resistivity depends primarily on the electrical prop-
erties of the fluid contained in the pore space. Hydrocarbon fluids are usually highly
resistive because they do not contain ions in solution. Formation water, by contrast, con-
tains ions in solution that can support an electrical current and have relatively small
resistivity. Resistivity logs can be used to distinguish between brine and hydrocarbon
fluids in the pore spaces of the formation. A resistivity log is illustrated in Figure 9.6.
Conrad and Marcel Schlumberger and Henri Doll first applied resistivity logs to
the evaluation of a formation in 1927. The technology has evolved considerably
since then. Here we introduce electrical properties of the ionic environment, the rela-
tionship between formation resistivity and wetting‐phase saturation, and then discuss
two types of resistivity logs: electrode logs and inductions logs.