
Page 179 - Introduction to Petroleum Engineering
P. 179
166 WELL LOGGING
Gamma (API units)
0 150
4000
Shale
4010
Clean
4020 sand
Depth (ft)
4030
Shale
4040
4050
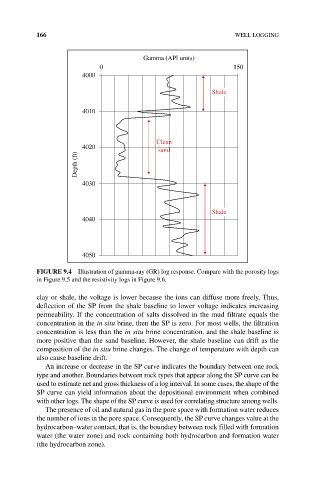
FIGuRE 9.4 Illustration of gamma‐ray (GR) log response. Compare with the porosity logs
in Figure 9.5 and the resistivity logs in Figure 9.6.
clay or shale, the voltage is lower because the ions can diffuse more freely. Thus,
deflection of the SP from the shale baseline to lower voltage indicates increasing
permeability. If the concentration of salts dissolved in the mud filtrate equals the
concentration in the in situ brine, then the SP is zero. For most wells, the filtration
concentration is less than the in situ brine concentration, and the shale baseline is
more positive than the sand baseline. However, the shale baseline can drift as the
composition of the in situ brine changes. The change of temperature with depth can
also cause baseline drift.
An increase or decrease in the SP curve indicates the boundary between one rock
type and another. Boundaries between rock types that appear along the SP curve can be
used to estimate net and gross thickness of a log interval. In some cases, the shape of the
SP curve can yield information about the depositional environment when combined
with other logs. The shape of the SP curve is used for correlating structure among wells.
The presence of oil and natural gas in the pore space with formation water reduces
the number of ions in the pore space. Consequently, the SP curve changes value at the
hydrocarbon–water contact, that is, the boundary between rock filled with formation
water (the water zone) and rock containing both hydrocarbon and formation water
(the hydrocarbon zone).