
Page 180 - Introduction to Petroleum Engineering
P. 180
POROSITY LOGS 167
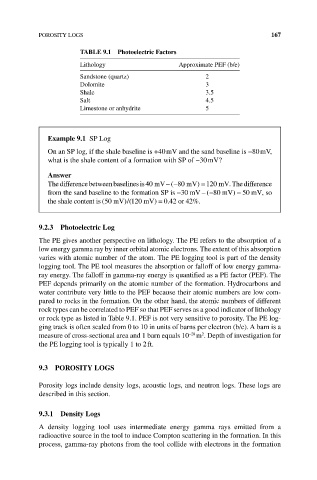
TabLE 9.1 Photoelectric Factors
Lithology Approximate PEF (b/e)
Sandstone (quartz) 2
Dolomite 3
Shale 3.5
Salt 4.5
Limestone or anhydrite 5
Example 9.1 SP Log
On an SP log, if the shale baseline is +40 mV and the sand baseline is −80 mV,
what is the shale content of a formation with SP of −30 mV?
answer
The difference between baselines is 40 mV–(− 80 mV) = 120 mV. The difference
from the sand baseline to the formation SP is −30 mV –( −80 mV) = 50 mV, so
=
the shale content is (50 mV ) (120 mV ) 042 or 42%.
.
/
9.2.3 Photoelectric Log
The PE gives another perspective on lithology. The PE refers to the absorption of a
low energy gamma ray by inner orbital atomic electrons. The extent of this absorption
varies with atomic number of the atom. The PE logging tool is part of the density
logging tool. The PE tool measures the absorption or falloff of low energy gamma‐
ray energy. The falloff in gamma‐ray energy is quantified as a PE factor (PEF). The
PEF depends primarily on the atomic number of the formation. Hydrocarbons and
water contribute very little to the PEF because their atomic numbers are low com-
pared to rocks in the formation. On the other hand, the atomic numbers of different
rock types can be correlated to PEF so that PEF serves as a good indicator of lithology
or rock type as listed in Table 9.1. PEF is not very sensitive to porosity. The PE log-
ging track is often scaled from 0 to 10 in units of barns per electron (b/e). A barn is a
2
–28
measure of cross‐sectional area and 1 barn equals 10 m . Depth of investigation for
the PE logging tool is typically 1 to 2 ft.
9.3 POROSITY LOGS
Porosity logs include density logs, acoustic logs, and neutron logs. These logs are
described in this section.
9.3.1 Density Logs
A density logging tool uses intermediate energy gamma rays emitted from a
radioactive source in the tool to induce Compton scattering in the formation. In this
process, gamma‐ray photons from the tool collide with electrons in the formation