
Page 230 - Introduction to Petroleum Engineering
P. 230
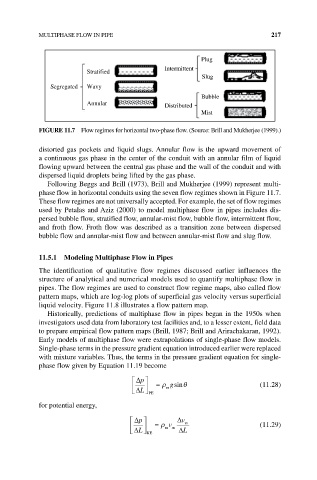
MULTIPHASE FLOW IN PIPE                                         217


                                                         Plug
                         Stratified            Intermittent
                                                         Slug
               Segregated  Wavy
                                                         Bubble
                         Annular               Distributed
                                                         Mist

            FIgURE 11.7  Flow regimes for horizontal two‐phase flow. (Source: Brill and Mukherjee (1999).)

            distorted gas pockets and liquid slugs. Annular flow is the upward movement of
            a continuous gas phase in the center of the conduit with an annular film of liquid
            flowing upward between the central gas phase and the wall of the conduit and with
            dispersed liquid droplets being lifted by the gas phase.
              Following Beggs and Brill (1973), Brill and Mukherjee (1999) represent multi-
            phase flow in horizontal conduits using the seven flow regimes shown in Figure 11.7.
            These flow regimes are not universally accepted. For example, the set of flow regimes
            used by Petalas and Aziz (2000) to model multiphase flow in pipes includes dis-
            persed bubble flow, stratified flow, annular‐mist flow, bubble flow, intermittent flow,
            and froth flow. Froth flow was described as a transition zone between dispersed
            bubble flow and annular‐mist flow and between annular‐mist flow and slug flow.


            11.5.1  Modeling Multiphase Flow in Pipes
            The identification of qualitative flow regimes discussed earlier influences the
            structure of analytical and numerical models used to quantify multiphase flow in
            pipes. The flow regimes are used to construct flow regime maps, also called flow
            pattern maps, which are log-log plots of superficial gas velocity versus superficial
            liquid velocity. Figure 11.8 illustrates a flow pattern map.
              Historically, predictions of multiphase flow in pipes began in the 1950s when
            investigators used data from laboratory test facilities and, to a lesser extent, field data
            to prepare empirical flow pattern maps (Brill, 1987; Brill and Arirachakaran, 1992).
            Early models of multiphase flow were extrapolations of single‐phase flow models.
            Single‐phase terms in the pressure gradient equation introduced earlier were replaced
            with mixture variables. Thus, the terms in the pressure gradient equation for single‐
            phase flow given by Equation 11.19 become
                                        p       gsin                     (11.28)
                                        L  PE  m

            for potential energy,
                                        p       v  v m                   (11.29)
                                       L  KE   mm   L