
Page 247 - Introduction to Petroleum Engineering
P. 247
234 TRANSIENT WELL TESTING
Horner plot
4000
m = Slope of line
3999
3998
Shut in pressure (psia) 3996
3997
3995
3994
3993
3992
3991
3990
1 10 100 1000
Horner time
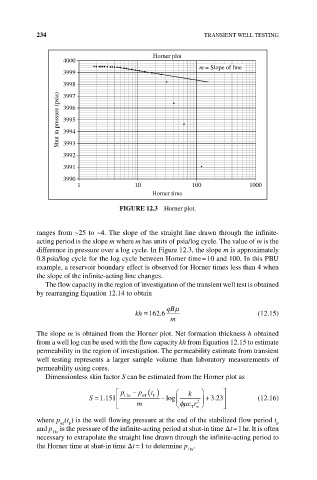
FIGURE 12.3 Horner plot.
ranges from ~25 to ~4. The slope of the straight line drawn through the infinite‐
acting period is the slope m where m has units of psia/log cycle. The value of m is the
difference in pressure over a log cycle. In Figure 12.3, the slope m is approximately
0.8 psia/log cycle for the log cycle between Horner time = 10 and 100. In this PBU
example, a reservoir boundary effect is observed for Horner times less than 4 when
the slope of the infinite‐acting line changes.
The flow capacity in the region of investigation of the transient well test is obtained
by rearranging Equation 12.14 to obtain
qB
.
kh 162 6 (12.15)
m
The slope m is obtained from the Horner plot. Net formation thickness h obtained
from a well log can be used with the flow capacity kh from Equation 12.15 to estimate
permeability in the region of investigation. The permeability estimate from transient
well testing represents a larger sample volume than laboratory measurements of
permeability using cores.
Dimensionless skin factor S can be estimated from the Horner plot as
p p t k
.
.
S 1 151 1 hr wf F log 2 323 (12.16)
m cr
Tw
where p (t ) is the well flowing pressure at the end of the stabilized flow period t
F
wf
F
and p is the pressure of the infinite‐acting period at shut‐in time Δt = 1 hr. It is often
1 hr
necessary to extrapolate the straight line drawn through the infinite‐acting period to
the Horner time at shut‐in time Δt = 1 to determine p .
1 hr