
Page 249 - Introduction to Petroleum Engineering
P. 249
236 TRANSIENT WELL TESTING
An example of a log–log diagnostic plot is presented in Figure 12.5 for a partially
completed well. The flow pattern for a partial completion is presented as the spherical
flow pattern in Figure 12.4. The spherical flow pattern appears after the wellbore
storage pressure response. The pressure response does not show as much structure as
the pressure derivative response labeled dp/d ln(Δt). The spherical flow pattern does
not continue until the end of the test. At some point in time spherical flow changes to
radial flow as fluid flow encounters the upper and lower boundaries of the reservoir.
The radial flow pattern appears as the pressure derivative response with a zero slope.
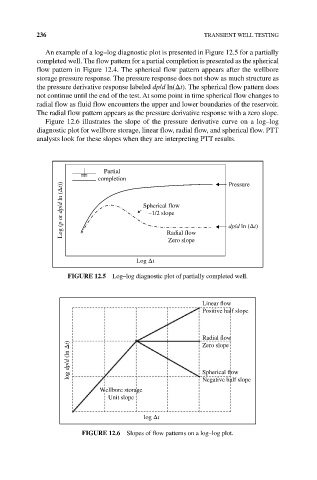
Figure 12.6 illustrates the slope of the pressure derivative curve on a log–log
diagnostic plot for wellbore storage, linear flow, radial flow, and spherical flow. PTT
analysts look for these slopes when they are interpreting PTT results.
Partial
completion Pressure
Log (p or dp/d ln ( t)) Spherical flow
–1/2 slope
Radial flow
Zero slope dp/d ln ( t)
Log t
FIGURE 12.5 Log–log diagnostic plot of partially completed well.
Linear ow
Positive half slope
Radial ow
log dp/d (ln t) Spherical ow
Zero slope
Wellbore storage Negative half slope
Unit slope
log t
FIGURE 12.6 Slopes of flow patterns on a log–log plot.