
Page 248 - Introduction to Petroleum Engineering
P. 248
OIL WELL PRESSURE TRANSIENT TESTING 235
Example 12.3 Permeability from the Horner Plot
Calculate the permeability of a drainage area based on a pressure buildup test
in an oil well with the following data: flow rate q = 78 STB/day, oil formation
volume factor B = 1.13 RB/STB, oil viscosity μ = 0.7 cp, formation thickness
h = 24 ft, and Horner plot slope m = 10 psia/log cycle.
Answer
qB
.
Solve kh 162 6 for permeability; thus
m
qB 78 1130 7
.
.
.
.
k 162 6 162 6 42md
mh 10 24
12.2.2 Interpreting Pressure Transient Tests
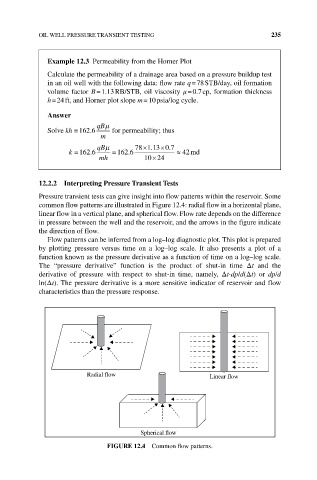
Pressure transient tests can give insight into flow patterns within the reservoir. Some
common flow patterns are illustrated in Figure 12.4: radial flow in a horizontal plane,
linear flow in a vertical plane, and spherical flow. Flow rate depends on the difference
in pressure between the well and the reservoir, and the arrows in the figure indicate
the direction of flow.
Flow patterns can be inferred from a log–log diagnostic plot. This plot is prepared
by plotting pressure versus time on a log–log scale. It also presents a plot of a
function known as the pressure derivative as a function of time on a log–log scale.
The “pressure derivative” function is the product of shut‐in time Δt and the
derivative of pressure with respect to shut‐in time, namely, Δt⋅dp/d(Δt) or dp/d
ln(Δt). The pressure derivative is a more sensitive indicator of reservoir and flow
characteristics than the pressure response.
Radial flow Linear flow
Spherical flow
FIGURE 12.4 Common flow patterns.