
Page 260 - Introduction to Petroleum Engineering
P. 260
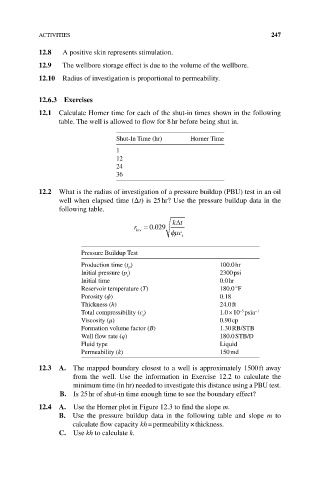
ACTIVITIES                                                      247
            12.8   A positive skin represents stimulation.

            12.9   The wellbore storage effect is due to the volume of the wellbore.
            12.10  Radius of investigation is proportional to permeability.

            12.6.3  Exercises

            12.1  Calculate Horner time for each of the shut‐in times shown in the following
                 table. The well is allowed to flow for 8 hr before being shut in.

                                 Shut‐In Time (hr)    Horner Time

                                 1
                                 12
                                 24
                                 36
            12.2  What is the radius of investigation of a pressure buildup (PBU) test in an oil
                 well when elapsed time (Δt) is 25 hr? Use the pressure buildup data in the
                   following table.
                                                 kt
                                            .
                                      r inv  0 029
                                                   c t
                        Pressure Buildup Test
                        Production time (t )                  100.0 hr
                                     F
                        Initial pressure (p )                 2300 psi
                                    i
                        Initial time                          0.0 hr
                        Reservoir temperature (T)             180.0 °F
                        Porosity (ϕ)                          0.18
                        Thickness (h)                         24.0 ft
                        Total compressibility (c ) t          1.0 × 10  psia −1
                                                                    −5
                        Viscosity (μ)                         0.90 cp
                        Formation volume factor (B)           1.30 RB/STB
                        Well flow rate (q)                    180.0 STB/D
                        Fluid type                            Liquid
                        Permeability (k)                      150 md

            12.3  A.   The mapped boundary closest to a well is approximately 1500 ft away
                     from the well. Use the information in Exercise 12.2 to calculate the
                     minimum time (in hr) needed to investigate this distance using a PBU test.
                  b.  Is 25 hr of shut‐in time enough time to see the boundary effect?
            12.4  A.  Use the Horner plot in Figure 12.3 to find the slope m.
                 b.  Use the pressure buildup data in the following table and slope  m to
                       calculate flow capacity kh = permeability × thickness.
                 C.  Use kh to calculate k.