
Page 29 - Introduction to Petroleum Engineering
P. 29
PETROLEUM ECONOMICS 13
Cash flow
80.00
NPV
60.00
NPV ($ millions) 40.00
20.00
0.00
1 2 3 4 5 6 7 8
–20.00
–40.00
Time (years)
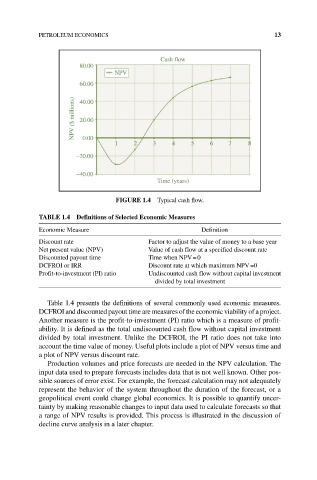
FIGURE 1.4 Typical cash flow.
TAbLE 1.4 Definitions of Selected Economic Measures
Economic Measure Definition
Discount rate Factor to adjust the value of money to a base year
Net present value (NPV) Value of cash flow at a specified discount rate
Discounted payout time Time when NPV = 0
DCFROI or IRR Discount rate at which maximum NPV =0
Profit‐to‐investment (PI) ratio Undiscounted cash flow without capital investment
divided by total investment
Table 1.4 presents the definitions of several commonly used economic measures.
DCFROI and discounted payout time are measures of the economic viability of a project.
Another measure is the profit‐to‐investment (PI) ratio which is a measure of profit-
ability. It is defined as the total undiscounted cash flow without capital investment
divided by total investment. Unlike the DCFROI, the PI ratio does not take into
account the time value of money. Useful plots include a plot of NPV versus time and
a plot of NPV versus discount rate.
Production volumes and price forecasts are needed in the NPV calculation. The
input data used to prepare forecasts includes data that is not well known. Other pos-
sible sources of error exist. For example, the forecast calculation may not adequately
represent the behavior of the system throughout the duration of the forecast, or a
geopolitical event could change global economics. It is possible to quantify uncer-
tainty by making reasonable changes to input data used to calculate forecasts so that
a range of NPV results is provided. This process is illustrated in the discussion of
decline curve analysis in a later chapter.