
Page 34 - Introduction to Petroleum Engineering
P. 34
18 INTRODUCTION
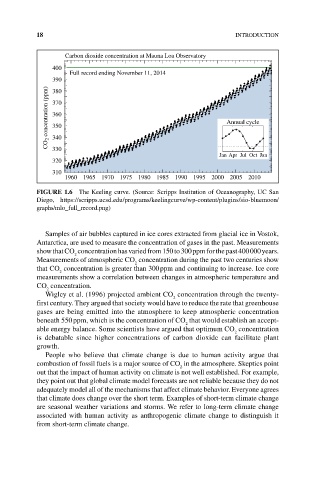
Carbon dioxide concentration at Mauna Loa Observatory
400
Full record ending November 11, 2014
390
CO 2 concentration (ppm) 370 Annual cycle
380
360
350
340
330
Jan Apr Jul Oct Jan
320
310
1960 1965 1970 1975 1980 1985 1990 1995 2000 2005 2010
FIGURE 1.6 The Keeling curve. (Source: Scripps Institution of Oceanography, UC San
Diego, https://scripps.ucsd.edu/programs/keelingcurve/wp‐content/plugins/sio‐bluemoon/
graphs/mlo_full_record.png)
Samples of air bubbles captured in ice cores extracted from glacial ice in Vostok,
Antarctica, are used to measure the concentration of gases in the past. Measurements
show that CO concentration has varied from 150 to 300 ppm for the past 400 000 years.
2
Measurements of atmospheric CO concentration during the past two centuries show
2
that CO concentration is greater than 300 ppm and continuing to increase. Ice core
2
measurements show a correlation between changes in atmospheric temperature and
CO concentration.
2
Wigley et al. (1996) projected ambient CO concentration through the twenty‐
2
first century. They argued that society would have to reduce the rate that greenhouse
gases are being emitted into the atmosphere to keep atmospheric concentration
beneath 550 ppm, which is the concentration of CO that would establish an accept-
2
able energy balance. Some scientists have argued that optimum CO concentration
2
is debatable since higher concentrations of carbon dioxide can facilitate plant
growth.
People who believe that climate change is due to human activity argue that
combustion of fossil fuels is a major source of CO in the atmosphere. Skeptics point
2
out that the impact of human activity on climate is not well established. For example,
they point out that global climate model forecasts are not reliable because they do not
adequately model all of the mechanisms that affect climate behavior. Everyone agrees
that climate does change over the short term. Examples of short‐term climate change
are seasonal weather variations and storms. We refer to long‐term climate change
associated with human activity as anthropogenic climate change to distinguish it
from short‐term climate change.