
Page 64 - Introduction to Petroleum Engineering
P. 64
48 PROPERTIES OF RESERVOIR FLUIDS
1000
Super
900
Liquid critical
800
700
Pressure (psia) 500 Vapor pressure cure
600
400
300
200
Gas
100
0
0 20 40 60 80 100 120
Temperature (°F)
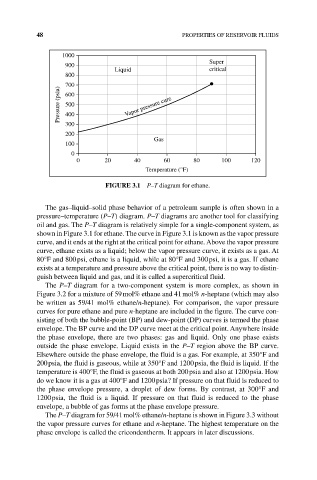
FIGURE 3.1 P–T diagram for ethane.
The gas–liquid–solid phase behavior of a petroleum sample is often shown in a
pressure–temperature (P–T) diagram. P–T diagrams are another tool for classifying
oil and gas. The P–T diagram is relatively simple for a single‐component system, as
shown in Figure 3.1 for ethane. The curve in Figure 3.1 is known as the vapor pressure
curve, and it ends at the right at the critical point for ethane. Above the vapor pressure
curve, ethane exists as a liquid; below the vapor pressure curve, it exists as a gas. At
80°F and 800 psi, ethane is a liquid, while at 80°F and 300 psi, it is a gas. If ethane
exists at a temperature and pressure above the critical point, there is no way to distin-
guish between liquid and gas, and it is called a supercritical fluid.
The P–T diagram for a two‐component system is more complex, as shown in
Figure 3.2 for a mixture of 59 mol% ethane and 41 mol% n‐heptane (which may also
be written as 59/41 mol% ethane/n‐heptane). For comparison, the vapor pressure
curves for pure ethane and pure n‐heptane are included in the figure. The curve con-
sisting of both the bubble‐point (BP) and dew‐point (DP) curves is termed the phase
envelope. The BP curve and the DP curve meet at the critical point. Anywhere inside
the phase envelope, there are two phases: gas and liquid. Only one phase exists
outside the phase envelope. Liquid exists in the P–T region above the BP curve.
Elsewhere outside the phase envelope, the fluid is a gas. For example, at 350°F and
200 psia, the fluid is gaseous, while at 350°F and 1200 psia, the fluid is liquid. If the
temperature is 400°F, the fluid is gaseous at both 200 psia and also at 1200 psia. How
do we know it is a gas at 400°F and 1200 psia? If pressure on that fluid is reduced to
the phase envelope pressure, a droplet of dew forms. By contrast, at 300°F and
1200 psia, the fluid is a liquid. If pressure on that fluid is reduced to the phase
envelope, a bubble of gas forms at the phase envelope pressure.
The P–T diagram for 59/41 mol% ethane/n‐heptane is shown in Figure 3.3 without
the vapor pressure curves for ethane and n‐heptane. The highest temperature on the
phase envelope is called the cricondentherm. It appears in later discussions.