
Page 66 - Introduction to Petroleum Engineering
P. 66
50 PROPERTIES OF RESERVOIR FLUIDS
TAbLE 3.1 Classifications of Oils and Gases Using Pressure–Temperature Diagrams
Dominant Phases at Separator
Phase in Pressure and
Fluid Type Reservoir Reservoir Temperature Temperature
Black oil Liquid Far to the left of the critical point Liquid and gas
Volatile oil Liquid Left of, but close to, the critical point Liquid and gas
Retrograde gas Gas Between critical point and Liquid and gas
cricondentherm
Wet gas Gas Right of the cricondentherm Liquid and gas
Dry gas Gas Right of the cricondentherm Gas
TAbLE 3.2 Classification of Oils and Gases by Generally Available Properties
Gas–oil Ratio Formation Volume Stock Tank Gravity Color of Separator
(SCF/STB) Factor of Oil of Oil, °API Liquid
(RB/STB)
0 0.00 10 Black
. . . .
1000 Black oil . . .
. 1.00 20 Brown Black oil
2000 . Black oil . .
. Volatile oil . . Black oil .
3000 2.00 30 Red
. . . . Volatile oil
4000 . . .
. Retrograde 3.00 40 Orange
5000 gas . . .
. . . . Retrograde
. 4.00 Volatile oil 50 Volatile oil Yellow gas
. . . .
50 000 . . Retrograde . Wet gas
. 5.00 60 or wet gas Clear
100 000 Wet . .
. gas . .
150 000 6.00 70
.
than BP pressure, which is the pressure on the BP pressure curve at reservoir temperature.
Production of oil will result in the decline of reservoir pressure. Reservoir temperature
does not change significantly, if at all, and can be considered constant. When reservoir
pressure declines below BP pressure, the remaining hydrocarbon mixture enters the
two‐phase gas–oil region where both an oil phase and a gas phase coexist.
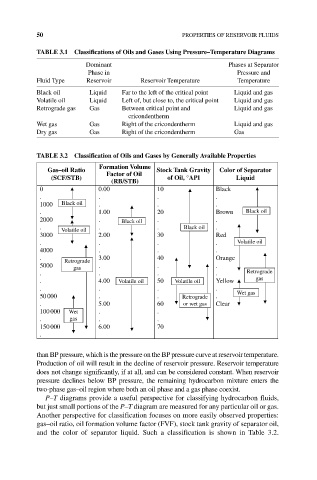
P–T diagrams provide a useful perspective for classifying hydrocarbon fluids,
but just small portions of the P–T diagram are measured for any particular oil or gas.
Another perspective for classification focuses on more easily observed properties:
gas–oil ratio, oil formation volume factor (FVF), stock tank gravity of separator oil,
and the color of separator liquid. Such a classification is shown in Table 3.2.