
Page 65 - Introduction to Petroleum Engineering
P. 65
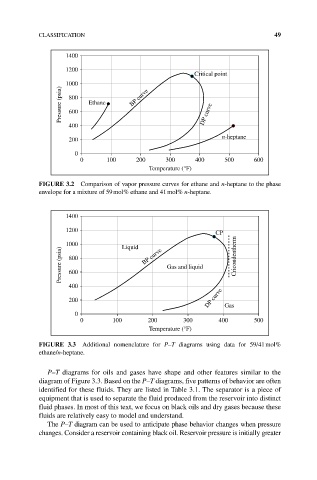
CLASSIFICATION                                                   49

                   1400

                   1200
                                                       Critical point
                   1000
                  Pressure (psia)  800  Ethane  BP curve  DP curve


                    600
                    400

                    200                                        n-heptane
                      0
                       0       100     200     300     400     500      600
                                          Temperature (°F)
            FIGURE 3.2  Comparison of vapor pressure curves for ethane and n‐heptane to the phase
            envelope for a mixture of 59 mol% ethane and 41 mol% n‐heptane.


                   1400
                   1200                                      CP

                  Pressure (psia) 1000  Liquid  BP curve  Gas and liquid  Cricondentherm
                    800
                    600

                    400
                                                           DP curve
                    200                                        Gas

                      0
                       0        100       200       300       400       500
                                          Temperature (°F)

            FIGURE  3.3  Additional nomenclature for  P–T diagrams using data for 59/41 mol%
            ethane/n‐heptane.


              P–T diagrams for oils and gases have shape and other features similar to the
              diagram of Figure 3.3. Based on the P–T diagrams, five patterns of behavior are often
            identified for these fluids. They are listed in Table 3.1. The separator is a piece of
            equipment that is used to separate the fluid produced from the reservoir into distinct
            fluid phases. In most of this text, we focus on black oils and dry gases because these
            fluids are relatively easy to model and understand.
              The P–T diagram can be used to anticipate phase behavior changes when pressure
            changes. Consider a reservoir containing black oil. Reservoir pressure is initially greater