
Page 287 - Introduction to chemical reaction engineering and kinetics
P. 287
268 Chapter 10: Biochemical Reactions: Enzyme Kinetics
Although, in principle, values of both V,,, and K,,, can be obtained from a Lineweaver-
Burk plot, the value of K,,, obtained from the slope is often a poor one. The most accu-
rately known values of rp, are those near V,,, (at high values of csJ; these are grouped
near the origin on the Lineweaver-Burk plot (at l/c,, = 0), and lead to a very good value
of vm,, itself. The least accurately known values are at low values of csO; these are far
removed from the origin, and greatly influence the value of the slope, resulting in a
possibly poor estimate of Km. Thus, use of linear regression with unweighted data may
lead to a good estimate of V,,, and a poor estimate of Km. A better estimate of the
latter may result from using equation 10.2-8, from the value of csO corresponding to
V,,,,,/2. Nevertheless, the experimental determination of Michaelis rate parameters,
V max and Km, is shown in the following example for the initial-rate method with the
Lineweaver-Burk expression. Other linear forms of equation 10.3-1 are possible, and
are explored in problem 10-5.
The hydrolysis of sucrose (S) catalyzed by the enzyme invertase has been studied by mea-
. . .
surmg the rmtral rate, rpo, at a series of initial concentrations of sucrose (csJ. At a partic-
ular temperature and enzyme concentration, the following results were obtained (Chase et
al., 1962):
cs,/mol L-l 0.0292 0.0584 0.0876 0.117 0.146 0.175 0.234
rp,/mol L-’ s-l 0.182 0.265 0.311 0.330 0.349 0.372 0.371
Determine the values of V,,, and the Michaelis constant Km in the Michaelis-Menten
rate law.
‘7O-F
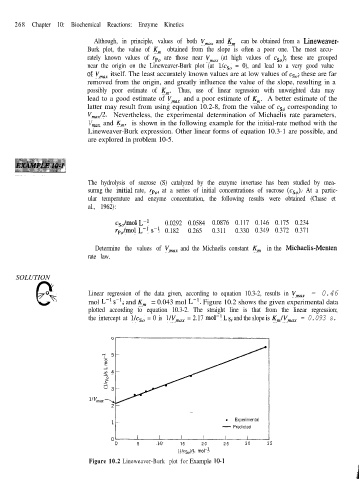
0 Linear regression of the data given, according to equation 10.3-2, results in V,,, = 0.46
SOLUTION v
mol L-’ s-l, and Km = 0.043 mol L-l. Figure 10.2 shows the given experimental data
plotted according to equation 10.3-2. The straight line is that from the linear regression;
the intercept at l/c,, = 0 is l/V,,, = 2.17 mol-l L s, and the slope is Km/V,,, = 0.093 s.
l Experimental
-Predicted
0 5 -M 15 2 0 2 5 3 0 3 5
(l/cs,)/L mol-l
Figure 10.2 Lineweaver-Burk plot for Example 10-1