
Page 167 -
P. 167
150 Chapter 5
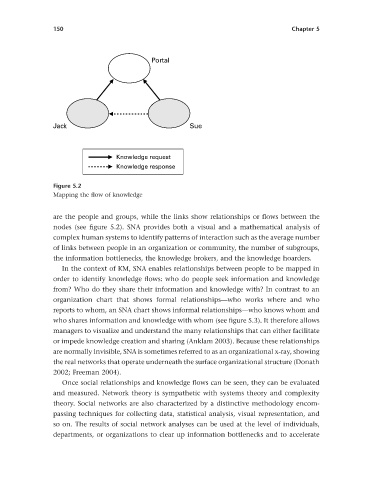
Portal
Jack Sue
Knowledge request
Knowledge response
Figure 5.2
Mapping the fl ow of knowledge
are the people and groups, while the links show relationships or fl ows between the
nodes (see fi gure 5.2 ). SNA provides both a visual and a mathematical analysis of
complex human systems to identify patterns of interaction such as the average number
of links between people in an organization or community, the number of subgroups,
the information bottlenecks, the knowledge brokers, and the knowledge hoarders.
In the context of KM, SNA enables relationships between people to be mapped in
order to identify knowledge fl ows: who do people seek information and knowledge
from? Who do they share their information and knowledge with? In contrast to an
organization chart that shows formal relationships — who works where and who
reports to whom, an SNA chart shows informal relationships — who knows whom and
who shares information and knowledge with whom (see fi gure 5.3 ). It therefore allows
managers to visualize and understand the many relationships that can either facilitate
or impede knowledge creation and sharing ( Anklam 2003 ). Because these relationships
are normally invisible, SNA is sometimes referred to as an organizational x-ray, showing
the real networks that operate underneath the surface organizational structure ( Donath
2002 ; Freeman 2004 ).
Once social relationships and knowledge fl ows can be seen, they can be evaluated
and measured. Network theory is sympathetic with systems theory and complexity
theory. Social networks are also characterized by a distinctive methodology encom-
passing techniques for collecting data, statistical analysis, visual representation, and
so on. The results of social network analyses can be used at the level of individuals,
departments, or organizations to clear up information bottlenecks and to accelerate