Page 350 - Laboratory Manual in Physical Geology
P. 350

EXPLANATION

                   San Francisco Bay
                                                                                      Alluvium and bay deposits
                                                               Niles
                                                                                         Consolidated rocks

                                                                                              Fault
                                                            Hayward Fault
                                                                                      Dashed where approximate,
                                                                                       dotted where concealed.
                                                                                              0.1
                                                                                       Line of equal subsidence
                                                                                   Interval 2, 0.5, and 0.1 foot; dashed
                               Menlo
                               Park                                                    where poorly controlled.

                                                                                      0      4       8 km
                                                                                     0     2     4    6 mi
                                                                 Agnew
                                                       Sunnyvale
                                                                    Santa
                                                                    Clara
                                                                     8      San Jose
                                                                     6
                                                                     4
                                                                     2
                                                                     0.5
                                                                     0.1
           This
           map
                                        San Andreas Fault


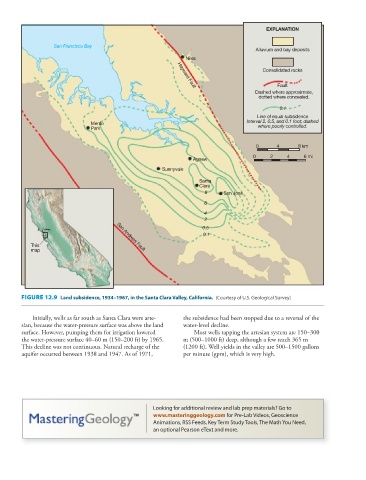
          FIGURE 12.9    Land subsidence, 1934–1967, in the Santa Clara Valley, California.         (Courtesy of U.S. Geological Survey)


                Initially, wells as far south as Santa Clara were arte-  the subsidence had been stopped due to a reversal of the
        sian, because the water-pressure surface was above the land   water-level decline.
        surface. However, pumping them for irrigation lowered       Most wells tapping the artesian system are 150–300
        the water-pressure surface 40–60 m (150–200 ft) by 1965.   m (500–1000 ft) deep, although a few reach 365 m
        This decline was not continuous. Natural recharge of the   (1200 ft). Well yields in the valley are 500–1500 gallons
        aquifer occurred between 1938 and 1947. As of 1971,   per minute (gpm), which is very high.


                                                      Looking for additional review and lab prep materials? Go to
                                                      www.masteringgeology.com  for Pre-Lab Videos, Geoscience
                                                    Animations, RSS Feeds, Key Term Study Tools, The Math You Need,
                                                    an optional Pearson eText and more.
   345   346   347   348   349   350   351   352   353   354   355