
Page 48 - Laboratory Manual in Physical Geology
P. 48
J. RATES:
1. Some geologists infer that Grand Canyon in Arizona is about 6 million
years old. Its greatest depth is 1.6 km.
a. At what rate (in mm/year) is the canyon being cut into the geosphere?
Show your work, and give your final answer in scientific notation
b. Based on the rate of canyon cutting that you just calculated above,
how many millimeters has the Grand Canyon deepened during your
lifetime? Show your work.
2. The geosphere is energized mostly by geothermal heat (heat originating
in Earth’s core). Therefore, it is much hotter deep inside Earth than it is
near the surface. The geothermal gradient is the rate of temperature increase
with depth from Earth’s surface. The deepest mine on Earth is located on the
African continent (Carletonville, South Africa: FIGURE 1.5 ). It is 3.9 km deep,
and rocks at that depth are 60°C. Assuming that rocks at the surface of the
mine are 0°C, what is the geothermal gradient at the mine? Show your work.
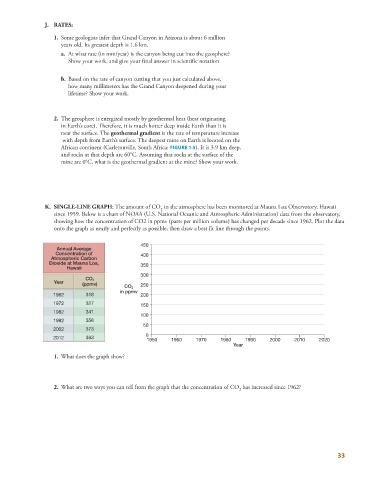
K. SINGLE-LINE GRAPH : The amount of CO in the atmosphere has been monitored at Mauna Loa Observatory, Hawaii
2
since 1959. Below is a chart of NOAA (U.S. National Oceanic and Atmospheric Administration) data from the observatory,
showing how the concentration of CO2 in ppmv (parts per million volume) has changed per decade since 1962. Plot the data
onto the graph as neatly and perfectly as possible, then draw a best fit line through the points.
450
Annual Average
Concentration of 400
Atmospheric Carbon
Dioxide at Mauna Loa, 350
Hawaii
300
CO 2
Year (ppmv)
CO 2 250
in ppmv
1962 318 200
1972 327 150
1982 341
100
1992 356
50
2002 373
0
2012 393 1950 1960 1970 1980 1990 2000 2010 2020
Year
1. What does the graph show?
2. What are two ways you can tell from the graph that the concentration of CO has increased since 1962?
2
33