
Page 242 - Lean six sigma demystified
P. 242
220 Lean Six Sigma DemystifieD
The Dirty 30 process has four steps.
1. Focus. Determine which error/fallout buckets to analyze first for maxi-
mum benefit. (This analysis takes 2 to 3 days.)
2. Improve. Use the Dirty 30 approach to analyze root causes (4 to 8 hours
per error type—facilitator with team) and determine requirements for
system enhancements to prevent the problem.
3. Sustain. Track the fallout after implementation of the system enhance-
ments.
4. Honor. Recognize and reward team members.
Quantify the Costs
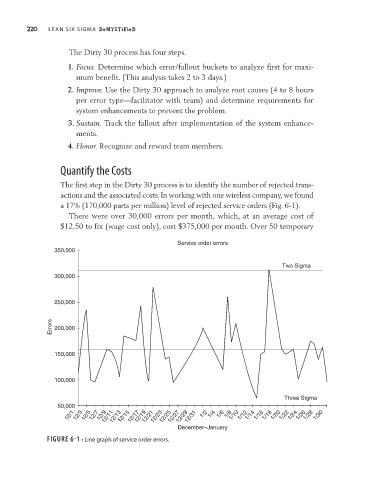
The first step in the Dirty 30 process is to identify the number of rejected trans-
actions and the associated costs. In working with one wireless company, we found
a 17% (170,000 parts per million) level of rejected service orders (Fig. 6-1).
There were over 30,000 errors per month, which, at an average cost of
$12.50 to fix (wage cost only), cost $375,000 per month. Over 50 temporary
Service order errors
350,000
Two Sigma
300,000
250,000
Errors 200,000
150,000
100,000
Three Sigma
50,000
12/1 12/3 12/5 12/7 12/9 12/11 12/13 12/15 12/17 12/19 12/21 12/23 12/25 12/27 12/29 12/31 1/2 1/4 1/6 1/8 1/10 1/12 1/14 1/16 1/18 1/20 1/22 1/24 1/26 1/28 1/30
December–January
Figure 6-1 • Line graph of service order errors.