
Page 243 - Lean six sigma demystified
P. 243
Chapter 6 Tr an S a C T iona L Six Sigm a 221
workers had been hired to deal with the 2-month backlog of unfixed errors. The
objective was to cut this level of rejects in half (9%) by the end of the year.
Understand the Pareto Pattern
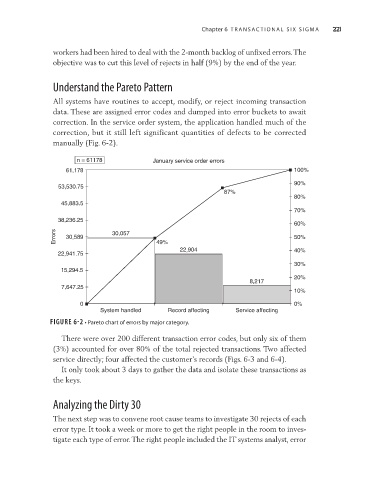
All systems have routines to accept, modify, or reject incoming transaction
data. These are assigned error codes and dumped into error buckets to await
correction. In the service order system, the application handled much of the
correction, but it still left significant quantities of defects to be corrected
manually (Fig. 6-2).
n = 61178 January service order errors
61,178 100%
90%
53,530.75
87%
80%
45,883.5
70%
38,236.25
60%
Errors 30,589 30,057 49% 50%
22,904 40%
22,941.75
30%
15,294.5
20%
8,217
7,647.25
10%
0 0%
System handled Record affecting Service affecting
Figure 6-2 • Pareto chart of errors by major category.
There were over 200 different transaction error codes, but only six of them
(3%) accounted for over 80% of the total rejected transactions. Two affected
service directly; four affected the customer’s records (Figs. 6-3 and 6-4).
It only took about 3 days to gather the data and isolate these transactions as
the keys.
Analyzing the Dirty 30
The next step was to convene root cause teams to investigate 30 rejects of each
error type. It took a week or more to get the right people in the room to inves-
tigate each type of error. The right people included the IT systems analyst, error