
Page 247 - Lean six sigma demystified
P. 247
Chapter 6 Tr an S a C T iona L Six Sigm a 225
Service order errors (PPM)
350000
300000
Errors (PPM)
250000
Average
Number of errors (PPM) 200000 First release
150000
release
100000 Second
50000
0
1-Dec 5-Dec 11-Dec 17-Dec 23-Dec 31-Dec 7-Jan 13-Jan 19-Jan 23-Jan 29-Jan 2-May 6-May 10-May 14-May 18-May 22-May 26-May 29-May 2-Jun 6-Jun 10-Jun 14-Jun
Time
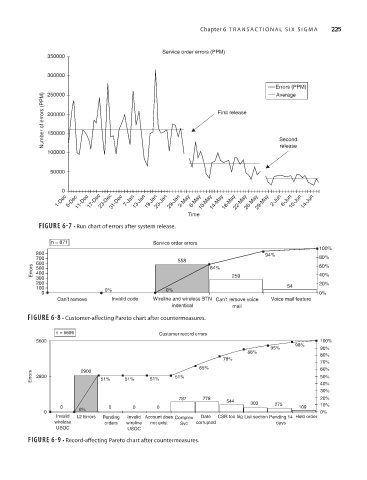
Figure 6-7 • Run chart of errors after system release.
n = 871 Service order errors
100%
800 94%
700 558 80%
Errors 600 64% 259 60%
500
400
40%
300
200 20%
100 0% 0% 54
0 0%
Can’t remove Invalid code Wireline and wireless BTN Can’t remove voice Voice mail feature
indentical mail
Figure 6-8 • Customer-affecting Pareto chart after countermeasures.
n = 5696 Customer record errors
5600 100%
95% 98% 90%
88% 80%
78%
70%
65% 60%
2900
Errors 2800 51% 51% 51% 51% 50%
40%
30%
787 778 20%
544 303
0 0% 0 0 0 275 109 10%
0 0%
Invalid L2 Errors Pending Invalid Account does Complex Date CSR too big List section Pending 14 Held order
wireless orders wireline not exist Svc corrupted days
USOC USOC
Figure 6-9 • Record-affecting Pareto chart after countermeasures.