
Page 65 - Materials Chemistry, Second Edition
P. 65
52
Life Cycle Assessment: Principles, Practice and Prospects Commercial
Municipal
Building Timber Other and industrial
rubble 1% 12% Other Food and
1% garden
24%
13%
Plastics
4%
Metal Food and
5% garden
Timber
47% Paper
9%
22%
Glass
Building
7% rubble Glass
3% Plastics Metal 2%
Paper
5% 22%
23%
Construction
Food and and demolition
garden
Metal Glass 1% Paper
7% 0%
0%
Other
6% Plastics
0%
Timber
4%
Building
rubble
82%
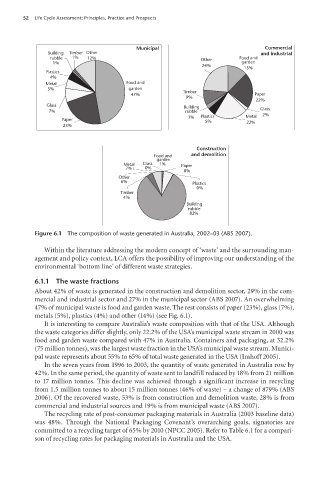
Figure 6.1 The composition of waste generated in Australia, 2002–03 (ABS 2007).
Within the literature addressing the modern concept of ‘waste’ and the surrounding man-
agement and policy context, LCA offers the possibility of improving our understanding of the
environmental ‘bottom line’ of different waste strategies.
6.1.1 The waste fractions
About 42% of waste is generated in the construction and demolition sector, 29% in the com-
mercial and industrial sector and 27% in the municipal sector (ABS 2007). An overwhelming
47% of municipal waste is food and garden waste. The rest consists of paper (23%), glass (7%),
metals (5%), plastics (4%) and other (14%) (see Fig. 6.1).
It is interesting to compare Australia’s waste composition with that of the USA. Although
the waste categories differ slightly, only 22.2% of the USA’s municipal waste stream in 2000 was
food and garden waste compared with 47% in Australia. Containers and packaging, at 32.2%
(75 million tonnes), was the largest waste fraction in the USA’s municipal waste stream. Munici-
pal waste represents about 55% to 65% of total waste generated in the USA (Imhoff 2005).
In the seven years from 1996 to 2003, the quantity of waste generated in Australia rose by
42%. In the same period, the quantity of waste sent to landfill reduced by 18% from 21 million
to 17 million tonnes. This decline was achieved through a significant increase in recycling
from 1.5 million tonnes to about 15 million tonnes (46% of waste) – a change of 879% (ABS
2006). Of the recovered waste, 53% is from construction and demolition waste, 28% is from
commercial and industrial sources and 19% is from municipal waste (ABS 2007).
The recycling rate of post-consumer packaging materials in Australia (2003 baseline data)
was 48%. Through the National Packaging Covenant’s overarching goals, signatories are
committed to a recycling target of 65% by 2010 (NPCC 2005). Refer to Table 6.1 for a compari-
son of recycling rates for packaging materials in Australia and the USA.
100804•Life Cycle Assessment 5pp.indd 52 17/02/09 12:46:17 PM