
Page 68 - Materials Chemistry, Second Edition
P. 68
Mass presented at kerbside (kg) per household per week Life cycle assessment and waste management 55
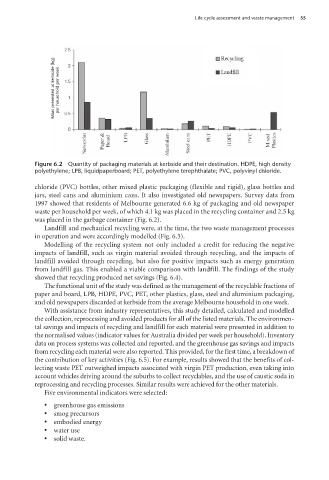
Figure 6.2 Quantity of packaging materials at kerbside and their destination. HDPE, high density
polyethylene; LPB, liquidpaperboard; PET, polyethylene terephthalate; PVC, polyvinyl chloride.
chloride (PVC) bottles, other mixed plastic packaging (flexible and rigid), glass bottles and
jars, steel cans and aluminium cans. It also investigated old newspapers. Survey data from
1997 showed that residents of Melbourne generated 6.6 kg of packaging and old newspaper
waste per household per week, of which 4.1 kg was placed in the recycling container and 2.5 kg
was placed in the garbage container (Fig. 6.2).
Landfill and mechanical recycling were, at the time, the two waste management processes
in operation and were accordingly modelled (Fig. 6.3).
Modelling of the recycling system not only included a credit for reducing the negative
impacts of landfill, such as virgin material avoided through recycling, and the impacts of
landfill avoided through recycling, but also for positive impacts such as energy generation
from landfill gas. This enabled a viable comparison with landfill. The findings of the study
showed that recycling produced net savings (Fig. 6.4).
The functional unit of the study was defined as the management of the recyclable fractions of
paper and board, LPB, HDPE, PVC, PET, other plastics, glass, steel and aluminium packaging,
and old newspapers discarded at kerbside from the average Melbourne household in one week.
With assistance from industry representatives, this study detailed, calculated and modelled
the collection, reprocessing and avoided products for all of the listed materials. The environmen-
tal savings and impacts of recycling and landfill for each material were presented in addition to
the normalised values (indicator values for Australia divided per week per household). Inventory
data on process systems was collected and reported, and the greenhouse gas savings and impacts
from recycling each material were also reported. This provided, for the first time, a breakdown of
the contribution of key activities (Fig. 6.5). For example, results showed that the benefits of col-
lecting waste PET outweighed impacts associated with virgin PET production, even taking into
account vehicles driving around the suburbs to collect recyclables, and the use of caustic soda in
reprocessing and recycling processes. Similar results were achieved for the other materials.
Five environmental indicators were selected:
s greenhouse gas emissions
s smog precursors
s embodied energy
s water use
s solid waste.
100804•Life Cycle Assessment 5pp.indd 55 17/02/09 12:46:17 PM