
Page 93 - Materials Chemistry, Second Edition
P. 93
Life Cycle Assessment: Principles, Practice and Prospects
80
Table 7.1 Subsystem aggregations
Concrete systems Ceiling and wall systems
Concrete in situ Masonry block walls
Pre-cast concrete Cement render
Bored piles Plasterboard, fibreboard
Retaining wall Tiling
Steelwork systems Glasswork
Hand rails, barriers gates and other steelwork Interior paintwork
Facade metal cladding Seating and roof systems
Structural steelwork Stadium seating
Building services systems Polycarbonate roof
Hydraulics system Other systems
Mechanical and air conditioning system Lifts and escalators
Electrical system Arena track
Fire service system
Stormwater system
other studies especially for the operational phase; for example, forecast energy use for the
building (Rudds 1998) and forecast water use (Sinclair Knight Merz 1998) (cited in Janssen
and Buckland 2000).
7.2.1.1 Results
Table 7.2 summarises the LCA results for energy use, greenhouse gas emissions, solid waste
production and water use (DPWS 1998, cited in Janssen 1999).
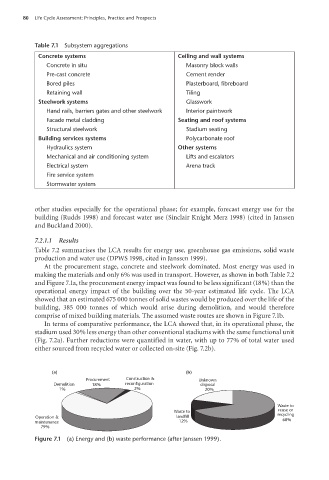
At the procurement stage, concrete and steelwork dominated. Most energy was used in
making the materials and only 6% was used in transport. However, as shown in both Table 7.2
and Figure 7.1a, the procurement energy impact was found to be less significant (18%) than the
operational energy impact of the building over the 50-year estimated life cycle. The LCA
showed that an estimated 675 000 tonnes of solid wastes would be produced over the life of the
building, 385 000 tonnes of which would arise during demolition, and would therefore
comprise of mixed building materials. The assumed waste routes are shown in Figure 7.1b.
In terms of comparative performance, the LCA showed that, in its operational phase, the
stadium used 30% less energy than other conventional stadiums with the same functional unit
(Fig. 7.2a). Further reductions were quantified in water, with up to 77% of total water used
either sourced from recycled water or collected on-site (Fig. 7.2b).
(a) (b)
Procurement Construction & Unknown
Demolition 18% reconfiguration disposal
1% 2% 20%
Waste to
Waste to reuse or
Operation & landfill recycling
maintenance 12% 68%
79%
Figure 7.1 (a) Energy and (b) waste performance (after Janssen 1999).
100804•Life Cycle Assessment 5pp.indd 80 17/02/09 12:46:19 PM