
Page 96 - Materials Chemistry, Second Edition
P. 96
Life cycle assessment: applications in the built environment
2
the past 20 years to a current average of 258 m . The study assumed that average new house size 83
2
will continue to increase slightly and then decline to 240 m by 2055, and that multi-unit resi-
2
dential properties will stabilise at 115 m over the same period. A projected growth in building
demand over the next 50 years was also taken into account. No major changes in relative per-
centages of materials used (e.g. through shifts in market preference) were assumed within each
building type.
Stakeholder consultation about the research findings, including the provision of expert
advice and additional contacts with industry bodies, assisted in developing the range of measures
which formed the recommendations of the study. Building industry associations and individual
companies provided life cycle data that enriched and expanded the existing data sets held by the
Centre for Design at RMIT University, while interviews with industry practitioners explored
barriers to the uptake of more sustainable products and practices. Stakeholder workshops were
held in Sydney, Melbourne, Brisbane, Adelaide, Perth and Hobart during which a wide range of
comments, questions and ideas were received from the 160 workshop participants.
7.2.2.1 Results
The quantities of materials used in buildings and their environmental impacts have risen
sharply in the 20 years to 2005. The largest flows identified occur in the new residential con-
struction sector followed closely by the home improvement sector, then by non-residential
construction and multi-residential construction. As a consequence of the growth in house size,
even though material intensity per square metre has decreased significantly, this material effi-
ciency has been offset by faster growth in building size.
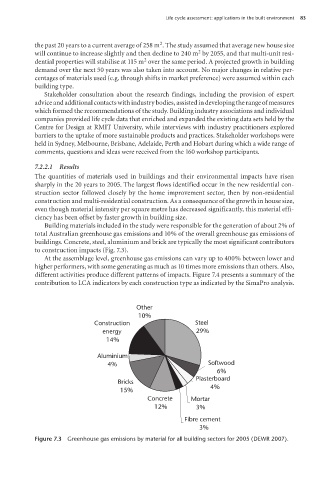
Building materials included in the study were responsible for the generation of about 2% of
total Australian greenhouse gas emissions and 10% of the overall greenhouse gas emissions of
buildings. Concrete, steel, aluminium and brick are typically the most significant contributors
to construction impacts (Fig. 7.3).
At the assemblage level, greenhouse gas emissions can vary up to 400% between lower and
higher performers, with some generating as much as 10 times more emissions than others. Also,
different activities produce different patterns of impacts. Figure 7.4 presents a summary of the
contribution to LCA indicators by each construction type as indicated by the SimaPro analysis.
Other
10%
Construction Steel
energy 29%
14%
Aluminium
4% Softwood
6%
Plasterboard
Bricks
4%
15%
Concrete Mortar
12% 3%
Fibre cement
3%
Figure 7.3 Greenhouse gas emissions by material for all building sectors for 2005 (DEWR 2007).
100804•Life Cycle Assessment 5pp.indd 83 17/02/09 12:46:19 PM