
Page 94 - Materials Chemistry, Second Edition
P. 94
Life cycle assessment: applications in the built environment
Table 7.2 Summary of Stadium Australia LCA results (Janssen 1999) 81
Construction Operation
and and
Procurement re-configuration maintenance Demolition Total
Primary energy 1370 150 6000 80 7600
use (TJ) 18% 2% 79% 1%
Greenhouse gas 140 10 470 5 625
emissions (‘000 22% 2% 75% 1%
tonnes CO eq.)
2
Solid wastes – 80 50 160 385 675
recycled or 12% 7% 24% 57%
landfilled (‘000
tonnes)
Water use (‘000 680 90 2250 5 3025
tonnes) 22% 3% 74% >> 1%
12
TJ, teraJoules (10 Joules); ‘000 tonnes CO eq., thousand tonnes of carbon dioxide equivalent greenhouse gas
2
emissions.
7.2.1.2 Discussion
LCA was used in this project primarily to help Multiplex Construction to quantify the envi-
ronmental performance of Stadium Australia; to set a benchmark for future stadiums and to
ensure that the regulatory and planning requirements were met. To expedite the collection of
data, the requirement for data collection was integrated into the contractual arrangements.
According to Buckland, it is the first time subcontractors have participated in an inventory,
and ‘collection of information was not easy’ (Building Innovation and Construction Technol-
ogy 1999). Despite the contractual requirements, the timing of the data collection was prob-
lematic and provided a challenge for the timely completion of the LCA. On the positive side,
this innovative approach paid off in this early example of the use of LCA in assisting the builder
in choosing environmentally preferable building materials, and also helping inform design
issues such as waste and energy efficiency (Janssen and Buckland 2000).
While there are many lessons from this case study, in hindsight, perhaps the most signifi-
cant is how little LCA activity occurred in building and construction in the years immediately
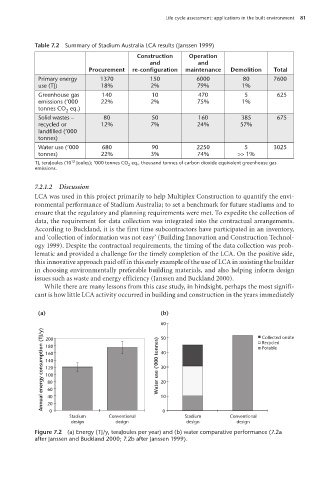
(a) (b)
60
Annual energy consumption (TJ/y) 160 Water use ('000 tonnes) 40
200 50 Collected onsite
Recycled
180
Potable
140
30
120
100
80
20
60
40
20
0
0
Stadium Conventional 10 Stadium Conventional
design design design design
Figure 7.2 (a) Energy (TJ/y, teraJoules per year) and (b) water comparative performance (7.2a
after Janssen and Buckland 2000; 7.2b after Janssen 1999).
100804•Life Cycle Assessment 5pp.indd 81 17/02/09 12:46:19 PM