
Page 66 - Materials Chemistry, Second Edition
P. 66
48 LIFE CYCLE ASSESSMENT HANDBOOK
illustration of the stages in a full life cycle inventory, beginning with raw mate-
rial extraction and continuing through end-of-life management of the finished
product. For each stage, the inventory quantifies the incoming flows from
nature and from the technosphere, including materials and energy, as well
as the outputs of useful products, co-products, and wastes, including solid
wastes and emissions released to air and water. Transportation between life
cycle stages is also included.
Figure 3.2 illustrates the stages for the life cycle of a PET bottle, such as those
used for bottled water and soft drinks. (Note that this diagram focuses on the
bottle and does not show production of the bottle cap, label, product in the
bottle, or packaging used for shipping filled bottles. A full life cycle for a bottled
product would include all the additional components.)
Life cycle stages often include complex networks of unit processes. For
example, the steps required for cradle-to-resin production of virgin PET resin
(shown as the first two highlighted blocks on Figure 3.2) expands to the net-
work of processes shown Figure 3.3.
The scoping process must capture all stages and operations that are needed
for the functional equivalence basis that has been selected for the analysis.
Energy Energy
1 1
Product use
or
consumption
r
Wastes Wastes
Recycle
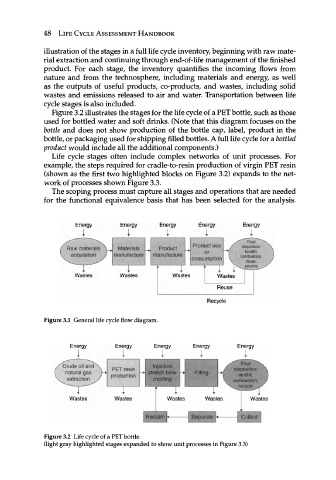
Figure 3.1 General life cycle flow diagram.
Energy
1
injection
PET resin
production stretch blow
molding
Wastes
Reclaim
Figure 3.2 Life cycle of a PET bottle.
(light gray highlighted stages expanded to show unit processes in Figure 3.3)