
Page 224 - Materials Chemistry, Second Edition
P. 224
Comparing Various Indicators for the LCA 213
The environmental impact of the PV system will be quantified by using various
environmental indicators. We will mention some one-dimensional indicators:
Global Warming Potential (GWP), Cumulative Energy Demand (CED), Energy
Payback Time (EPT), Net Energy Ratio (NER), and Fossil Energy Requirement
(FER). Also, one multidimensional indicator will be discussed here, namely the
Eco-Indicator 99 with its three perspectives: Hierarchist (H,A), Egalitarian (E,E)
and Individualist (I,I). Many other methods can be found in the literature; a
nonexhaustive overview can be found in the Ecoinvent report n° 3 (Frischkneicht
and Jungbluth 2007). The main difference between a one-dimensional indicator
and a multidimensional is that the latter combines multiple environmental effects
into one number, and thus aims to provide a more nuanced picture of the envi-
ronmental impact of a good or service.
Most of the LCA studies, however, focus only on one-dimensional indicators,
mainly related to the impact on climate change, (fossil) energy use and energy
efficiency. For example, two recent reviews by Varun and his colleagues focus
almost entirely on GHG emissions (Varun et al. 2009a, b). Others mainly consider
the energy payback time (Ito et al. 2003; Kato et al. 1997; Mason et al. 2006). This
one-dimensional view has the advantage of being relatively simple to interpret. On
the other hand, it has the obvious disadvantage of leaving many—possibly
important—parameters unexplored. The Eco-Indicator 99 method can be a tool to
overcome this issue and obtain a broader perspective.
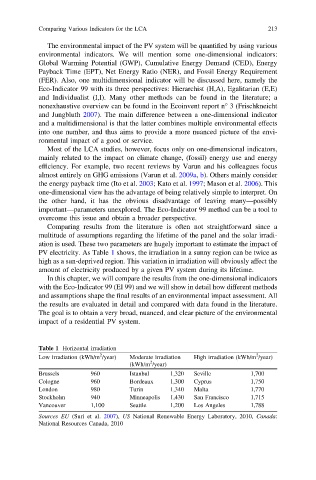
Comparing results from the literature is often not straightforward since a
multitude of assumptions regarding the lifetime of the panel and the solar irradi-
ation is used. These two parameters are hugely important to estimate the impact of
PV electricity. As Table 1 shows, the irradiation in a sunny region can be twice as
high as a sun-deprived region. This variation in irradiation will obviously affect the
amount of electricity produced by a given PV system during its lifetime.
In this chapter, we will compare the results from the one-dimensional indicators
with the Eco-Indicator 99 (EI 99) and we will show in detail how different methods
and assumptions shape the final results of an environmental impact assessment. All
the results are evaluated in detail and compared with data found in the literature.
The goal is to obtain a very broad, nuanced, and clear picture of the environmental
impact of a residential PV system.
Table 1 Horizontal irradiation
2
2
Low irradiation (kWh/m /year) Moderate irradiation High irradiation (kWh/m /year)
2
(kWh/m /year)
Brussels 960 Istanbul 1,320 Seville 1,700
Cologne 960 Bordeaux 1,300 Cyprus 1,750
London 980 Turin 1,340 Malta 1,770
Stockholm 940 Minneapolis 1,430 San Francisco 1,715
Vancouver 1,100 Seattle 1,200 Los Angeles 1,788
Sources EU (Suri et al. 2007), US National Renewable Energy Laboratory, 2010, Canada:
National Resources Canada, 2010