
Page 231 - Materials Chemistry, Second Edition
P. 231
220 R. Laleman et al.
40,000 6,000
CED/kWp CED/m² 5,000
30,000
CED/kWp (MJ-eq/kWp) 20,000 4,000 CED/m² (MJ-eq/m²)
3,000
2,000
10,000
0 1,000
-
mono c-Si multi c-Si a-Si CdTe CIS Ribbon Si
2
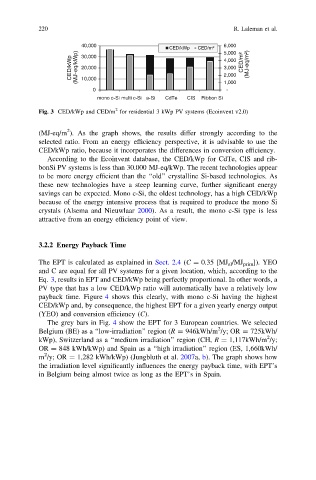
Fig. 3 CED/kWp and CED/m for residential 3 kWp PV systems (Ecoinvent v2.0)
2
(MJ-eq/m ). As the graph shows, the results differ strongly according to the
selected ratio. From an energy efficiency perspective, it is advisable to use the
CED/kWp ratio, because it incorporates the differences in conversion efficiency.
According to the Ecoinvent database, the CED/kWp for CdTe, CIS and rib-
bonSi PV systems is less than 30.000 MJ-eq/kWp. The recent technologies appear
to be more energy efficient than the ‘‘old’’ crystalline Si-based technologies. As
these new technologies have a steep learning curve, further significant energy
savings can be expected. Mono c-Si, the oldest technology, has a high CED/kWp
because of the energy intensive process that is required to produce the mono Si
crystals (Alsema and Nieuwlaar 2000). As a result, the mono c-Si type is less
attractive from an energy efficiency point of view.
3.2.2 Energy Payback Time
The EPT is calculated as explained in Sect. 2.4 (C = 0.35 [MJ el /MJ prim ]). YEO
and C are equal for all PV systems for a given location, which, according to the
Eq. 3, results in EPT and CED/kWp being perfectly proportional. In other words, a
PV type that has a low CED/kWp ratio will automatically have a relatively low
payback time. Figure 4 shows this clearly, with mono c-Si having the highest
CED/kWp and, by consequence, the highest EPT for a given yearly energy output
(YEO) and conversion efficiency (C).
The grey bars in Fig. 4 show the EPT for 3 European countries. We selected
2
Belgium (BE) as a ‘‘low-irradiation’’ region (R = 946kWh/m /y; OR = 725kWh/
2
kWp), Switzerland as a ‘‘medium irradiation’’ region (CH, R = 1,117kWh/m /y;
OR = 848 kWh/kWp) and Spain as a ‘‘high irradiation’’ region (ES, 1,660kWh/
2
m /y; OR = 1,282 kWh/kWp) (Jungbluth et al. 2007a, b). The graph shows how
the irradiation level significantly influences the energy payback time, with EPT’s
in Belgium being almost twice as long as the EPT’s in Spain.