
Page 232 - Materials Chemistry, Second Edition
P. 232
Comparing Various Indicators for the LCA 221
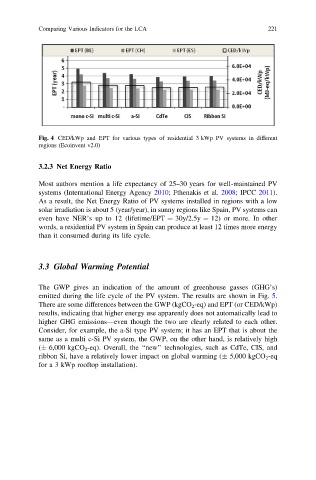
Fig. 4 CED/kWp and EPT for various types of residential 3 kWp PV systems in different
regions (Ecoinvent v2.0)
3.2.3 Net Energy Ratio
Most authors mention a life expectancy of 25–30 years for well-maintained PV
systems (International Energy Agency 2010; Fthenakis et al. 2008; IPCC 2011).
As a result, the Net Energy Ratio of PV systems installed in regions with a low
solar irradiation is about 5 (year/year), in sunny regions like Spain, PV systems can
even have NER’s up to 12 (lifetime/EPT = 30y/2.5y = 12) or more. In other
words, a residential PV system in Spain can produce at least 12 times more energy
than it consumed during its life cycle.
3.3 Global Warming Potential
The GWP gives an indication of the amount of greenhouse gasses (GHG’s)
emitted during the life cycle of the PV system. The results are shown in Fig. 5.
There are some differences between the GWP (kgCO 2 -eq) and EPT (or CED/kWp)
results, indicating that higher energy use apparently does not automatically lead to
higher GHG emissions—even though the two are clearly related to each other.
Consider, for example, the a-Si type PV system; it has an EPT that is about the
same as a multi c-Si PV system, the GWP, on the other hand, is relatively high
(± 6,000 kgCO 2 -eq). Overall, the ‘‘new’’ technologies, such as CdTe, CIS, and
ribbon Si, have a relatively lower impact on global warming (± 5,000 kgCO 2 -eq
for a 3 kWp rooftop installation).