
Page 317 - Materials Chemistry, Second Edition
P. 317
316 15. Barriers identification and prioritization
j,L j,M j,U
j
where e ω ¼ ω , ω B , ω B represents the fuzzy weight (relative influences) of the most in-
B
B
j,L
j
fluential factor on the j-th factor, e ω ¼ ω , ω j,M , ω j,U represents the fuzzy weight (relative
k k k k
j
j,L
influences) of the k-th factor on the j-th factor, e ω ¼ ω , ω j,M , ω j,U represents the weight
W W W W
(relative influences) of the least influential (worst) factor on the j-th factor,
j j,L j,M j,U
e a ¼ a , a , a represents the relative preference of the most influential factor
Bk Bk Bk Bk
j
comparing with the k-th factor regarding their relative influences on the j-th factor, and e a ¼
kW
j,L j,M j,U
a , a , a represents the relative preference of the k-th factor comparing with the least
kW kW kW
influential factor regarding their relative influences on the j-th factor.
After solving the programming (15.12), the fuzzy weights (relative influences) of the T
elements can be determined.
Substep 4: Defuzzying the fuzzy weights into crisp weights.
h i
The fuzzy weights of these T elements e ω j e ω j ⋯ e ω j , which represent the relative influ-
1 2 T
ences of these factors on the j-th factor, can be transformed into crisp numbers
h i
ω j ω j ⋯ ω j by Eq.(15.13).
1 2 T
ω j,L +4ω j,M + ω j,U
j k k k
ω ¼ (15.13)
k 6
j
where ω k represents the defuzzied weight of the k-th factor with respect to its influence on the
j-th factor.
Substep 5: Consistency check.
In this step, a consistency check will be carried out to measure the overall consistency
of the BO and OW vectors. The consistency ratio (CR) can be calculated by Eq. (15.14).
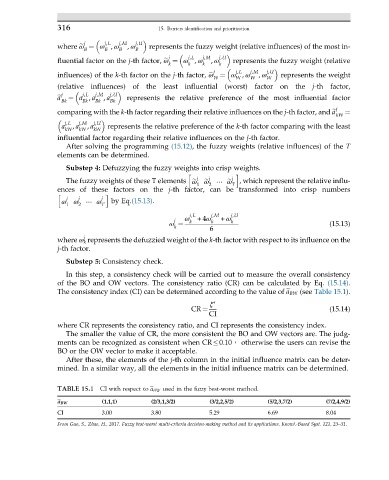
The consistency index (CI) can be determined according to the value of e a BW (see Table 15.1).
ξ ∗
CR ¼ (15.14)
CI
where CR represents the consistency ratio, and CI represents the consistency index.
The smaller the value of CR, the more consistent the BO and OW vectors are. The judg-
ments can be recognized as consistent when CR 0.10, otherwise the users can revise the
BO or the OW vector to make it acceptable.
After these, the elements of the j-th column in the initial influence matrix can be deter-
mined. In a similar way, all the elements in the initial influence matrix can be determined.
TABLE 15.1 CI with respect to e a BW used in the fuzzy best-worst method.
(1,1,1) (2/3,1,3/2) (3/2,2,5/2) (5/2,3,7/2) (7/2,4,9/2)
e a BW
CI 3.00 3.80 5.29 6.69 8.04
From Guo, S., Zhao, H., 2017. Fuzzy best-worst multi-criteria decision-making method and its applications. Knowl.-Based Syst. 121, 23–31.