Page 322 - Materials Chemistry, Second Edition
P. 322

15.4 Results and discussion                 321
                                        0:2348 + 4 0:2753 + 0:3101
                                  ω T 2  ¼                      ¼ 0:2744               (15.24)
                                                   6
                                   EC 3
                                        0:1001 + 4 0:1053 + 0:1122
                                  ω T 2  ¼                      ¼ 0:1056               (15.25)
                                                   6
                                   SM 1
                                        0:1511 + 4 0:1689 + 0:2096
                                  ω T 2  ¼                      ¼ 0:1727               (15.26)
                                                   6
                                   SM 2

              Substep 5: Consistency check.
              The consistency ratio can be determined by Eq. (15.27).
                                              ξ ∗  0:4074
                                         CR ¼    ¼      ¼ 0:0507                       (15.27)
                                              CI   8:04
              It is apparent that CR is less than 0.10; thus, the consistency of these judgments is accept-
            able, and the judgments of the experts for determining the weights (relative influences) of
            these four influential factors are effective.
              In a similar way, the relative influences of the influential factors on each factor can be de-
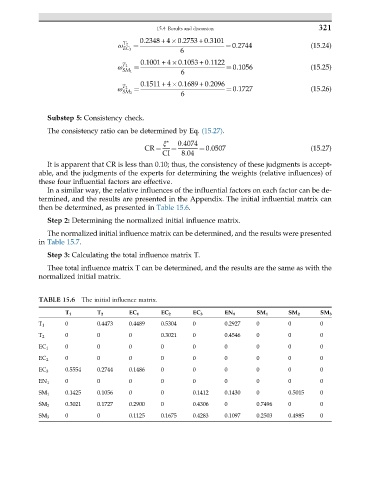
            termined, and the results are presented in the Appendix. The initial influential matrix can
            then be determined, as presented in Table 15.6.
              Step 2: Determining the normalized initial influence matrix.
              The normalized initial influence matrix can be determined, and the results were presented
            in Table 15.7.
              Step 3: Calculating the total influence matrix T.
              Thee total influence matrix T can be determined, and the results are the same as with the
            normalized initial matrix.


            TABLE 15.6  The initial influence matrix.
                   T 1      T 2      EC 1     EC 2     EC 3    EN 1     SM 1     SM 2     SM 3
                   0        0.4473   0.4489   0.5304   0       0.2927   0        0        0
            T 1
                   0        0        0        0.3021   0       0.4546   0        0        0
            T 2
                   0        0        0        0        0       0        0        0        0
            EC 1
                   0        0        0        0        0       0        0        0        0
            EC 2
                   0.5554   0.2744   0.1486   0        0       0        0        0        0
            EC 3
            EN 1   0        0        0        0        0       0        0        0        0
            SM 1   0.1425   0.1056   0        0        0.1412  0.1430   0        0.5015   0
            SM 2   0.3021   0.1727   0.2900   0        0.4306  0        0.7496   0        0
            SM 3   0        0        0.1125   0.1675   0.4283  0.1097   0.2503   0.4985   0
   317   318   319   320   321   322   323   324   325   326   327