
Page 323 - Materials Chemistry, Second Edition
P. 323
322 15. Barriers identification and prioritization
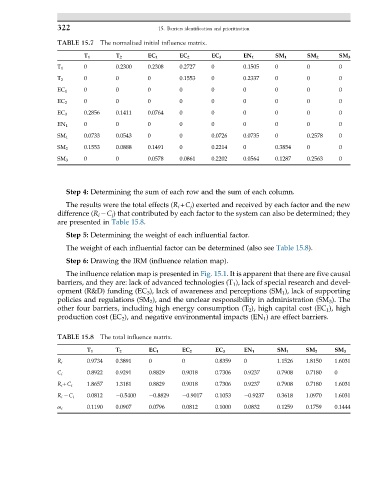
TABLE 15.7 The normalized initial influence matrix.
T 1 T 2 EC 1 EC 2 EC 3 EN 1 SM 1 SM 2 SM 3
0 0.2300 0.2308 0.2727 0 0.1505 0 0 0
T 1
T 2 0 0 0 0.1553 0 0.2337 0 0 0
EC 1 0 0 0 0 0 0 0 0 0
EC 2 0 0 0 0 0 0 0 0 0
EC 3 0.2856 0.1411 0.0764 0 0 0 0 0 0
EN 1 0 0 0 0 0 0 0 0 0
SM 1 0.0733 0.0543 0 0 0.0726 0.0735 0 0.2578 0
SM 2 0.1553 0.0888 0.1491 0 0.2214 0 0.3854 0 0
SM 3 0 0 0.0578 0.0861 0.2202 0.0564 0.1287 0.2563 0
Step 4: Determining the sum of each row and the sum of each column.
The results were the total effects (R i +C j ) exerted and received by each factor and the new
difference (R i C j ) that contributed by each factor to the system can also be determined; they
are presented in Table 15.8.
Step 5: Determining the weight of each influential factor.
The weight of each influential factor can be determined (also see Table 15.8).
Step 6: Drawing the IRM (influence relation map).
The influence relation map is presented in Fig. 15.1. It is apparent that there are five causal
barriers, and they are: lack of advanced technologies (T 1 ), lack of special research and devel-
opment (R&D) funding (EC 3 ), lack of awareness and perceptions (SM 1 ), lack of supporting
policies and regulations (SM 2 ), and the unclear responsibility in administration (SM 3 ). The
other four barriers, including high energy consumption (T 2 ), high capital cost (EC 1 ), high
production cost (EC 2 ), and negative environmental impacts (EN 1 ) are effect barriers.
TABLE 15.8 The total influence matrix.
T 1 T 2 EC 1 EC 2 EC 3 EN 1 SM 1 SM 2 SM 3
0.9734 0.3891 0 0 0.8359 0 1.1526 1.8150 1.6031
R i
C i 0.8922 0.9291 0.8829 0.9018 0.7306 0.9237 0.7908 0.7180 0
R i +C i 1.8657 1.3181 0.8829 0.9018 0.7306 0.9237 0.7908 0.7180 1.6031
R i C i 0.0812 0.5400 0.8829 0.9017 0.1053 0.9237 0.3618 1.0970 1.6031
ω i 0.1190 0.0907 0.0796 0.0812 0.1000 0.0832 0.1259 0.1759 0.1444