
Page 64 - Materials Chemistry, Second Edition
P. 64
4.1 Introduction 59
environmental component has been reasonably justified by the fragility and impossibility to
compensate large scale or long-term impacts (Kl€ opffer 2003). Resource efficiency and
eco-efficiency assessment have, then, been developed, opening the era of more comprehen-
sive assessment.
The conceptual approach for Life Cycle Sustainability Assessment (LCSA) has been, in fact,
summarized by Kl€ opffer (2003, 2008) as an addition of environmental LCA (LCA), economic
LCA (life cycle costing (LCC)), and social LCA (SLCA), based on the very same inventory of
material and energy flows:
LCSA ¼ LCA + LCC + SLCA
In order to take a significant step towards the LCSA, overcoming the limits of LCA, the
Sixth Framework Program of the European Commission, in 2006, supported CALCAS, i.e.,
coordination action for innovation in life cycle analysis for sustainability (Kl€ oepffer, 2008;
Guin ee, et al., 2011). Given the complexity of the theme and the extent of the stakeholder au-
dience, a multidisciplinary lens has been applied on the subject, to provide the governance
system with a decision support tool.
In the following years, the body of knowledge has been increasing progressively, in both
research conversation and practice standardization. In order to explore the development of
LCSA, a literature review has been performed, based on Web of Science database (http://
apps.webofknowledge.com; Accessed March 1, 2019). A total amount of 230 papers resulted
from the search based on titles of papers published between 1997 and the first quarter of 2019.
A brief descriptive analysis of the body of papers identified is reported in the following.
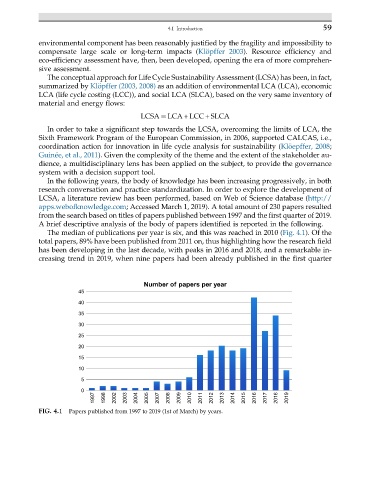
The median of publications per year is six, and this was reached in 2010 (Fig. 4.1). Of the
total papers, 89% have been published from 2011 on, thus highlighting how the research field
has been developing in the last decade, with peaks in 2016 and 2018, and a remarkable in-
creasing trend in 2019, when nine papers had been already published in the first quarter
Number of papers per year
45
40
35
30
25
20
15
10
5
0
1997 1998 2002 2003 2004 2005 2007 2008 2009 2010 2011 2012 2013 2014 2015 2016 2017 2018 2019
FIG. 4.1 Papers published from 1997 to 2019 (1st of March) by years.