
Page 203 - Lindens Handbook of Batteries
P. 203
AN INTRODUCTION TO PRIMARY BATTERIES 8.15
3.0
Li/MnO *
2
2.0
Voltage, V Li/FeS 2
1.0
Alkaline-MnO 2
Zinc-carbon
0
0 0.4 0.8 1.2 1.6 2.0 2.4 2.8 3.0
Discharge capacity, Ah
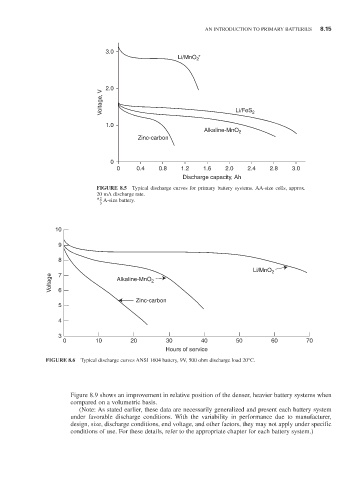
FIGURE 8.5 Typical discharge curves for primary battery systems. AA-size cells, approx.
20 mA discharge rate.
2
* A-size battery.
3
10
9
8
Li/MnO 2
7
Voltage 6 Alkaline-MnO 2
Zinc-carbon
5
4
3
0 10 20 30 40 50 60 70
Hours of service
FIGURE 8.6 Typical discharge curves ANSI 1604 battery, 9V, 500 ohm discharge load 20°C.
Figure 8.9 shows an improvement in relative position of the denser, heavier battery systems when
compared on a volumetric basis.
(Note: As stated earlier, these data are necessarily generalized and present each battery system
under favorable discharge conditions. With the variability in performance due to manufacturer,
design, size, discharge conditions, end voltage, and other factors, they may not apply under specific
conditions of use. For these details, refer to the appropriate chapter for each battery system.)