
Page 84 - Lindens Handbook of Batteries
P. 84
FACTORS AFFECTING BATTERY PERFORMANCE 3.3
1
Voltage 2
3
0 Elapsed time of discharge
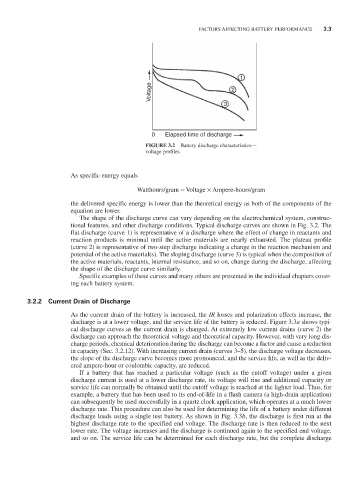
FIGURE 3.2 Battery discharge characteristics—
voltage profiles.
As specific energy equals
Watthours/gram = Voltage × Ampere-hours/gram
the delivered specific energy is lower than the theoretical energy as both of the components of the
equation are lower.
The shape of the discharge curve can vary depending on the electrochemical system, construc-
tional features, and other discharge conditions. Typical discharge curves are shown in Fig. 3.2. The
flat discharge (curve 1) is representative of a discharge where the effect of change in reactants and
reaction products is minimal until the active materials are nearly exhausted. The plateau profile
(curve 2) is representative of two-step discharge indicating a change in the reaction mechanism and
potential of the active material(s). The sloping discharge (curve 3) is typical when the composition of
the active materials, reactants, internal resistance, and so on, change during the discharge, affecting
the shape of the discharge curve similarly.
Specific examples of these curves and many others are presented in the individual chapters cover-
ing each battery system.
3.2.2 Current Drain of Discharge
As the current drain of the battery is increased, the IR losses and polarization effects increase, the
discharge is at a lower voltage, and the service life of the battery is reduced. Figure 3.3a shows typi-
cal discharge curves as the current drain is changed. At extremely low current drains (curve 2) the
discharge can approach the theoretical voltage and theoretical capacity. However, with very long dis-
charge periods, chemical deterioration during the discharge can become a factor and cause a reduction
in capacity (Sec. 3.2.12). With increasing current drain (curves 3–5), the discharge voltage decreases,
the slope of the discharge curve becomes more pronounced, and the service life, as well as the deliv-
ered ampere-hour or coulombic capacity, are reduced.
If a battery that has reached a particular voltage (such as the cutoff voltage) under a given
discharge current is used at a lower discharge rate, its voltage will rise and additional capacity or
service life can normally be obtained until the cutoff voltage is reached at the lighter load. Thus, for
example, a battery that has been used to its end-of-life in a flash camera (a high-drain application)
can subsequently be used successfully in a quartz clock application, which operates at a much lower
discharge rate. This procedure can also be used for determining the life of a battery under different
discharge loads using a single test battery. As shown in Fig. 3.3b, the discharge is first run at the
highest discharge rate to the specified end voltage. The discharge rate is then reduced to the next
lower rate. The voltage increases and the discharge is continued again to the specified end voltage,
and so on. The service life can be determined for each discharge rate, but the complete discharge