
Page 87 - Lindens Handbook of Batteries
P. 87
3.6 PRINCIPLES OF OPERATION
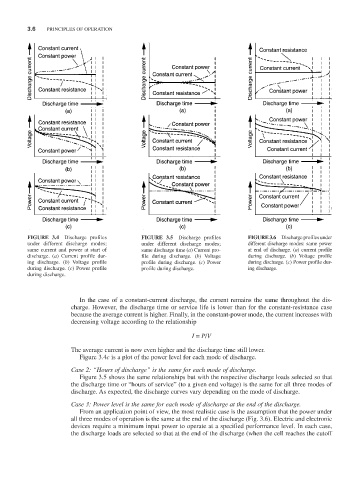
FIGURE 3.4 Discharge profiles FIGURE 3.5 Discharge profiles FIGURE 3.6 Discharge profiles under
under different discharge modes; under different discharge modes; different discharge modes: same power
same current and power at start of same discharge time (a) Current pro- at end of discharge. (a) current profile
discharge. (a) Current profile dur- file during discharge. (b) Voltage during discharge. (b) Voltage profile
ing discharge. (b) Voltage profile profile during discharge. (c) Power during discharge. (c) Power profile dur-
during discharge. (c) Power profile profile during discharge. ing discharge.
during discharge.
In the case of a constant-current discharge, the current remains the same throughout the dis-
charge. However, the discharge time or service life is lower than for the constant-resistance case
because the average current is higher. Finally, in the constant-power mode, the current increases with
decreasing voltage according to the relationship
I = P/V
The average current is now even higher and the discharge time still lower.
Figure 3.4c is a plot of the power level for each mode of discharge.
Case 2: “Hours of discharge” is the same for each mode of discharge.
Figure 3.5 shows the same relationships but with the respective discharge loads selected so that
the discharge time or “hours of service” (to a given end voltage) is the same for all three modes of
discharge. As expected, the discharge curves vary depending on the mode of discharge.
Case 3: Power level is the same for each mode of discharge at the end of the discharge.
From an application point of view, the most realistic case is the assumption that the power under
all three modes of operation is the same at the end of the discharge (Fig. 3.6). Electric and electronic
devices require a minimum input power to operate at a specified performance level. In each case,
the discharge loads are selected so that at the end of the discharge (when the cell reaches the cutoff