
Page 90 - Lindens Handbook of Batteries
P. 90
FACTORS AFFECTING BATTERY PERFORMANCE 3.9
It is recognized that the performance differences obtained when comparing batteries are directly
dependent on the differences in battery design and performance characteristics. With batteries that
are significantly different in design and characteristics, the performance obtained on test will be
quite different as shown in the comparisons between Figs. 3.7a and 3.7b. When the batteries are
similar, the performance differences obtained on any of the modes of discharge may not be large and
may not appear to be significantly different. However, just because the differences in this case are
small, it should not lead to the false assumption that testing under a discharge mode different from
the application would give accurate results.
This is illustrated in Fig. 3.7c, which shows the discharge characteristics of another battery
that has a slightly higher capacity and higher internal resistance than the one shown in Fig. 3.7a.
Although the differences are small, a careful comparison of the Fig. 3.7a with Fig. 3.7c at the dif-
ferent modes of discharge does show a different behavior in the hours of discharge obtained to the
specified 1.0 V end voltage. Under the constant-power mode, the hours of discharge show a slight
decrease comparing Fig. 3.7c with Fig. 3.7a, while there is a slight increase under the constant-
current and constant-resistance discharge modes.
(Note: The influence of end voltage should be noted. As 1.0 V was used as the end voltage in
determining the load values for these examples, this end voltage should be used in making compari-
sons. If discharged to lower end voltages, the service life for the constant-resistance mode increases
compared to the other modes because of the lower current and power levels. However, these lower
values may be inadequate for the specified application).
3.2.5 Temperature of Battery During Discharge
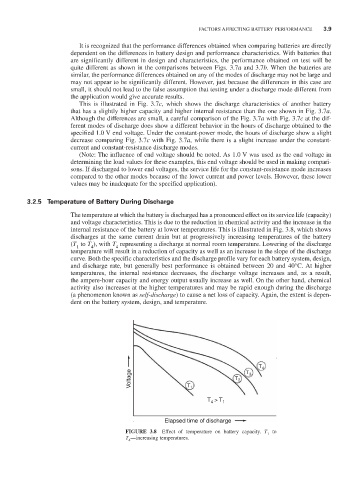
The temperature at which the battery is discharged has a pronounced effect on its service life (capacity)
and voltage characteristics. This is due to the reduction in chemical activity and the increase in the
internal resistance of the battery at lower temperatures. This is illustrated in Fig. 3.8, which shows
discharges at the same current drain but at progressively increasing temperatures of the battery
(T to T ), with T representing a discharge at normal room temperature. Lowering of the discharge
1
4
4
temperature will result in a reduction of capacity as well as an increase in the slope of the discharge
curve. Both the specific characteristics and the discharge profile vary for each battery system, design,
and discharge rate, but generally best performance is obtained between 20 and 40°C. At higher
temperatures, the internal resistance decreases, the discharge voltage increases and, as a result,
the ampere-hour capacity and energy output usually increase as well. On the other hand, chemical
activity also increases at the higher temperatures and may be rapid enough during the discharge
(a phenomenon known as self-discharge) to cause a net loss of capacity. Again, the extent is depen-
dent on the battery system, design, and temperature.
T 4
Voltage T 1 T 2 T 3
T 4 > T 1
Elapsed time of discharge
FIGURE 3.8 Effect of temperature on battery capacity. T to
1
T —increasing temperatures.
4