
Page 92 - Lindens Handbook of Batteries
P. 92
FACTORS AFFECTING BATTERY PERFORMANCE 3.11
3.2.6 Service Life
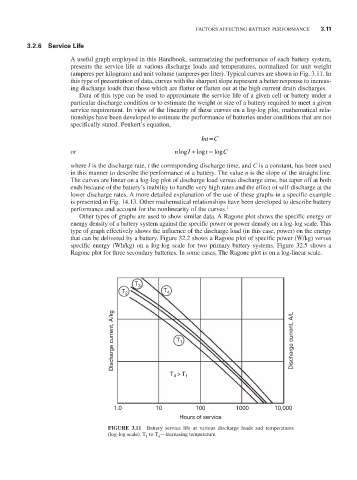
A useful graph employed in this Handbook, summarizing the performance of each battery system,
presents the service life at various discharge loads and temperatures, normalized for unit weight
(amperes per kilogram) and unit volume (amperes per liter). Typical curves are shown in Fig. 3.11. In
this type of presentation of data, curves with the sharpest slope represent a better response to increas-
ing discharge loads than those which are flatter or flatten out at the high current drain discharges.
Data of this type can be used to approximate the service life of a given cell or battery under a
particular discharge condition or to estimate the weight or size of a battery required to meet a given
service requirement. In view of the linearity of these curves on a log-log plot, mathematical rela-
tionships have been developed to estimate the performance of batteries under conditions that are not
specifically stated. Peukert’s equation,
IntC=
or nlog + I log t = log C
where I is the discharge rate, t the corresponding discharge time, and C is a constant, has been used
in this manner to describe the performance of a battery. The value n is the slope of the straight line.
The curves are linear on a log-log plot of discharge load versus discharge time, but taper off at both
ends because of the battery’s inability to handle very high rates and the effect of self-discharge at the
lower discharge rates. A more detailed explanation of the use of these graphs in a specific example
is presented in Fig. 14.13. Other mathematical relationships have been developed to describe battery
performance and account for the nonlinearity of the curves. 1
Other types of graphs are used to show similar data. A Ragone plot shows the specific energy or
energy density of a battery system against the specific power or power density on a log-log scale. This
type of graph effectively shows the influence of the discharge load (in this case, power) on the energy
that can be delivered by a battery. Figure 32.2 shows a Ragone plot of specific power (W/kg) versus
specific energy (Wh/kg) on a log-log scale for two primary battery systems. Figure 32.5 shows a
Ragone plot for three secondary batteries. In some cases, The Ragone plot is on a log-linear scale.
T 3
T 2 T 4
Discharge current, A/kg T 1 Discharge current, A/L
T > T 1
4
1.0 10 100 1000 10,000
Hours of service
FIGURE 3.11 Battery service life at various discharge loads and temperatures
(log-log scale). T to T —increasing temperature.
1
4