
Page 91 - Lindens Handbook of Batteries
P. 91
3.10 PRINCIPLES OF OPERATION
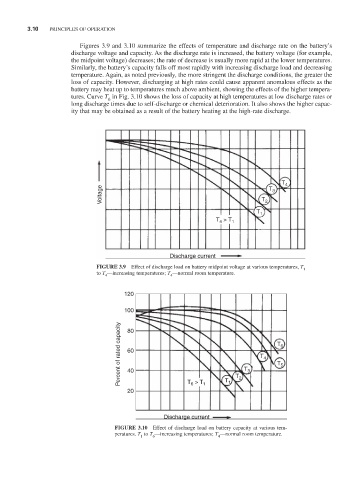
Figures 3.9 and 3.10 summarize the effects of temperature and discharge rate on the battery’s
discharge voltage and capacity. As the discharge rate is increased, the battery voltage (for example,
the midpoint voltage) decreases; the rate of decrease is usually more rapid at the lower temperatures.
Similarly, the battery’s capacity falls off most rapidly with increasing discharge load and decreasing
temperature. Again, as noted previously, the more stringent the discharge conditions, the greater the
loss of capacity. However, discharging at high rates could cause apparent anomalous effects as the
battery may heat up to temperatures much above ambient, showing the effects of the higher tempera-
tures. Curve T in Fig. 3.10 shows the loss of capacity at high temperatures at low discharge rates or
6
long discharge times due to self-discharge or chemical deterioration. It also shows the higher capac-
ity that may be obtained as a result of the battery heating at the high-rate discharge.
T 4
Voltage T 2 T 3
T 1
T > T 1
4
Discharge current
FIGURE 3.9 Effect of discharge load on battery midpoint voltage at various temperatures, T
1
to T —increasing temperatures; T —normal room temperature.
4
4
120
100
Percent of rated capacity 60 T 3 T 4 T 6 5
80
T
40
20 T 6 > T 1 T 1 T 2
Discharge current
FIGURE 3.10 Effect of discharge load on battery capacity at various tem-
peratures. T to T —increasing temperatures; T —normal room temperature.
1 6 4