
Page 83 - Lindens Handbook of Batteries
P. 83
3.2 PRINCIPLES OF OPERATION
3.2.1 Voltage Level
Different references are made to the voltage of a cell or battery:
1. The theoretical voltage is a function of the anode and cathode materials, the composition of the
electrolyte, and the temperature (usually stated at 25°C).
2. The open-circuit voltage is the voltage under a no-load condition and is usually a close approxi-
mation of the theoretical voltage.
3. The closed-circuit voltage is the voltage under a load condition.
4. The nominal voltage is one that is generally accepted as typical of the operating voltage of the
battery as, for example, 1.5 V for a zinc-manganese dioxide battery.
5. The working voltage is more representative of the actual operating voltage of the battery under
load and will be lower than the open-circuit voltage.
6. The average voltage is the voltage averaged during the discharge.
7. The midpoint voltage is the central voltage during the discharge of the cell or battery.
8. The end or cutoff voltage is designated as the end of the discharge. Usually it is the voltage above
which most of the capacity of the cell or battery has been delivered. The end voltage may also be
dependent on the application requirements.
Using the lead-acid battery as an example, the theoretical and open-circuit voltages are 2.1 V, the
nominal voltage is 2.0 V, the working voltage is between 1.8 and 2.0 V, and the end voltage is typi-
cally 1.75 V on moderate and low-drain discharges and 1.5 V for engine-cranking loads. On charge,
the voltage may range from 2.3 to 2.8 V.
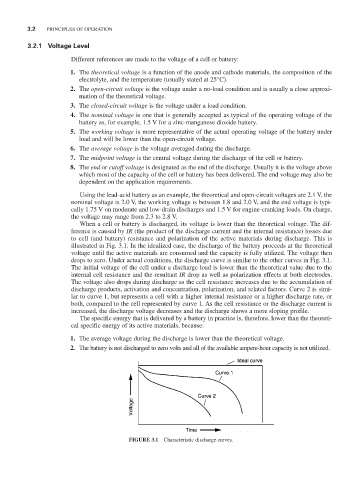
When a cell or battery is discharged, its voltage is lower than the theoretical voltage. The dif-
ference is caused by IR (the product of the discharge current and the internal resistance) losses due
to cell (and battery) resistance and polarization of the active materials during discharge. This is
illustrated in Fig. 3.1. In the idealized case, the discharge of the battery proceeds at the theoretical
voltage until the active materials are consumed and the capacity is fully utilized. The voltage then
drops to zero. Under actual conditions, the discharge curve is similar to the other curves in Fig. 3.1.
The initial voltage of the cell under a discharge load is lower than the theoretical value due to the
internal cell resistance and the resultant IR drop as well as polarization effects at both electrodes.
The voltage also drops during discharge as the cell resistance increases due to the accumulation of
discharge products, activation and concentration, polarization, and related factors. Curve 2 is simi-
lar to curve 1, but represents a cell with a higher internal resistance or a higher discharge rate, or
both, compared to the cell represented by curve 1. As the cell resistance or the discharge current is
increased, the discharge voltage decreases and the discharge shows a more sloping profile.
The specific energy that is delivered by a battery in practice is, therefore, lower than the theoreti-
cal specific energy of its active materials, because:
1. The average voltage during the discharge is lower than the theoretical voltage.
2. The battery is not discharged to zero volts and all of the available ampere-hour capacity is not utilized.
FIGURE 3.1 Characteristic discharge curves.