
Page 36 - MATLAB Recipes for Earth Sciences
P. 36
2.7 Basic Visualization Tools 27
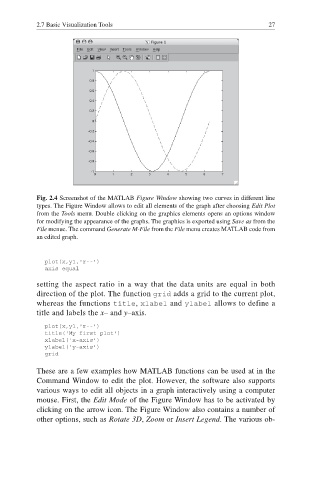
Fig. 2.4 Screenshot of the MATLAB Figure Window showing two curves in different line
types. The Figure Window allows to edit all elements of the graph after choosing Edit Plot
from the Tools menu. Double clicking on the graphics elements opens an options window
for modifying the appearance of the graphs. The graphics is exported using Save as from the
File menue. The command Generate M-File from the File menu creates MATLAB code from
an edited graph.
plot(x,y1,'r--')
axis equal
setting the aspect ratio in a way that the data units are equal in both
direction of the plot. The function grid adds a grid to the current plot,
whereas the functions title, xlabel and ylabel allows to define a
title and labels the x– and y–axis.
plot(x,y1,'r--')
title('My first plot')
xlabel('x-axis')
ylabel('y-axis')
grid
These are a few examples how MATLAB functions can be used at in the
Command Window to edit the plot. However, the software also supports
various ways to edit all objects in a graph interactively using a computer
mouse. First, the Edit Mode of the Figure Window has to be activated by
clicking on the arrow icon. The Figure Window also contains a number of
other options, such as Rotate 3D, Zoom or Insert Legend. The various ob-