
Page 408 -
P. 408
EFAB™ Technology and Applications 6-17
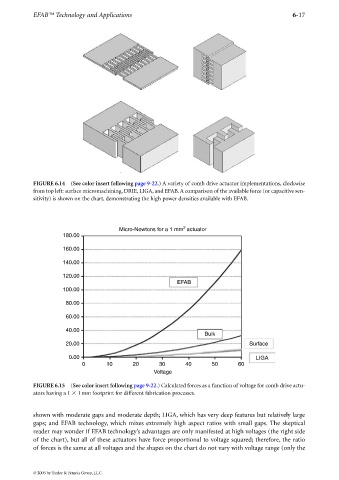
FIGURE 6.14 (See color insert following page 9-22.) A variety of comb drive actuator implementations, clockwise
from top left: surface micromachining, DRIE, LIGA, and EFAB. A comparison of the available force (or capacitive sen-
sitivity) is shown on the chart, demonstrating the high power densities available with EFAB.
2
Micro-Newtons for a 1 mm actuator
180.00
160.00
140.00
120.00
EFAB
100.00
80.00
60.00
40.00
Bulk
20.00 Surface
0.00 LIGA
0 10 20 30 40 50 60
Voltage
FIGURE 6.15 (See color insert following page 9-22.) Calculated forces as a function of voltage for comb drive actu-
ators having a 1 1 mm footprint for different fabrication processes.
shown with moderate gaps and moderate depth; LIGA, which has very deep features butrelatively large
gaps; and EFAB technology, which mixes extremely high aspect ratios with small gaps. The skeptical
reader may wonder if EFAB technology’s advantages are only manifested at high voltages (the right side
of the chart), but all of these actuators have force proportional to voltage squared; therefore, the ratio
of forces is the same at all voltages and the shapes on the chart do not vary with voltage range (only the
© 2006 by Taylor & Francis Group, LLC