
Page 149 - Machine Learning for Subsurface Characterization
P. 149
124 Machine learning for subsurface characterization
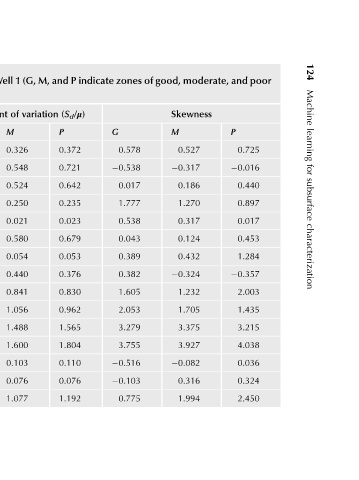
Statistical parameters of conventional and DD logs in Well 1 (G, M, and P indicate zones of good, moderate, and poor
0.725 0.016 0.440 0.897 0.017 0.453 1.284 0.357 2.003 1.435 3.215 4.038 0.036 0.324 2.450
P
Skewness M 0.527 0.317 0.186 1.270 0.317 0.124 0.432 0.324 1.232 1.705 3.375 3.927 0.082 0.316 1.994
0.578 0.538 0.017 1.777 0.538 0.043 0.389 0.382 1.605 2.053 3.279 3.755 0.516 0.103 0.775
G
(S d /μ) P 0.372 0.721 0.642 0.235 0.023 0.679 0.053 0.376 0.830 0.962 1.565 1.804 0.110 0.076 1.192
variation
of M 0.326 0.548 0.524 0.250 0.021 0.580 0.054 0.440 0.841 1.056 1.488 1.600 0.103 0.076 1.077
Coefficient
G 0.259 0.420 0.399 0.216 0.019 0.447 0.057 0.619 1.101 1.314 1.647 1.723 0.093 0.077 0.822
70.681 0.051 0.074 3.831 2.627 0.097 0.033 26.070 121.421 219.464 410.161 466.832 62.600 106.817 36.961
respectively). (μ) Mean 77.859 0.061 0.088 3.520 2.611 0.114 0.033 24.039 87.724 142.746 210.112 221.107 64.011 107.945 66.775
P
performances, M G 82.745 0.071 0.104 3.163 2.595 0.133 0.033 18.592 55.135 80.439 103.597 106.387 66.614 111.548 106.643
TABLE 4.4 log-synthesis GR DPHZ NPOR PEFZ RHOZ VCL RLA0 RLA1 RLA2 RLA3 RLA4 RLA5 DTC DTS σ f0