
Page 146 - Machine Learning for Subsurface Characterization
P. 146
122 Machine learning for subsurface characterization
as compared to memorization performance. Under data constraints, the training
and testing of a data-driven model are generally done in one well and then
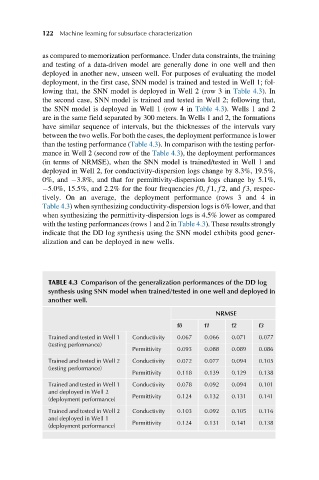
deployed in another new, unseen well. For purposes of evaluating the model
deployment, in the first case, SNN model is trained and tested in Well 1; fol-
lowing that, the SNN model is deployed in Well 2 (row 3 in Table 4.3). In
the second case, SNN model is trained and tested in Well 2; following that,
the SNN model is deployed in Well 1 (row 4 in Table 4.3). Wells 1 and 2
are in the same field separated by 300 meters. In Wells 1 and 2, the formations
have similar sequence of intervals, but the thicknesses of the intervals vary
between the two wells. For both the cases, the deployment performance is lower
than the testing performance (Table 4.3). In comparison with the testing perfor-
mance in Well 2 (second row of the Table 4.3), the deployment performances
(in terms of NRMSE), when the SNN model is trained/tested in Well 1 and
deployed in Well 2, for conductivity-dispersion logs change by 8.3%, 19.5%,
0%, and 3.8%, and that for permittivity-dispersion logs change by 5.1%,
5.0%, 15.5%, and 2.2% for the four frequencies f 0, f 1, f2, and f 3, respec-
tively. On an average, the deployment performance (rows 3 and 4 in
Table 4.3) when synthesizing conductivity-dispersion logs is 6% lower, and that
when synthesizing the permittivity-dispersion logs is 4.5% lower as compared
with the testing performances (rows 1 and 2 in Table 4.3). These results strongly
indicate that the DD log synthesis using the SNN model exhibits good gener-
alization and can be deployed in new wells.
TABLE 4.3 Comparison of the generalization performances of the DD log
synthesis using SNN model when trained/tested in one well and deployed in
another well.
NRMSE
f0 f1 f2 f3
Trained and tested in Well 1 Conductivity 0.067 0.066 0.071 0.077
(testing performance)
Permittivity 0.093 0.088 0.089 0.086
Trained and tested in Well 2 Conductivity 0.072 0.077 0.094 0.105
(testing performance)
Permittivity 0.118 0.139 0.129 0.138
Trained and tested in Well 1 Conductivity 0.078 0.092 0.094 0.101
and deployed in Well 2
(deployment performance) Permittivity 0.124 0.132 0.131 0.141
Trained and tested in Well 2 Conductivity 0.103 0.092 0.105 0.116
and deployed in Well 1
(deployment performance) Permittivity 0.124 0.131 0.141 0.138