
Page 141 - Machine Learning for Subsurface Characterization
P. 141
Stacked neural network architecture Chapter 4 117
3.1 Sensitivity analysis
For each case of the sensitivity analysis, 100 cycles with random initial weights
and biases and random training and testing datasets are run to ensure that the
SNN model optimization avoids local minima. For the purposes of the sensitiv-
ity analysis, we investigate the changes in the log-synthesis performance
achieved by the SNN model due to changes in inputs/features, outputs/targets,
and noise in data. NRMSEs for the synthesis of each conductivity and
permittivity-dispersion logs are summed together to compute the accuracy drop
in %. An accuracy drop of 1% corresponds to an approximate NRMSE change
of 0.007.
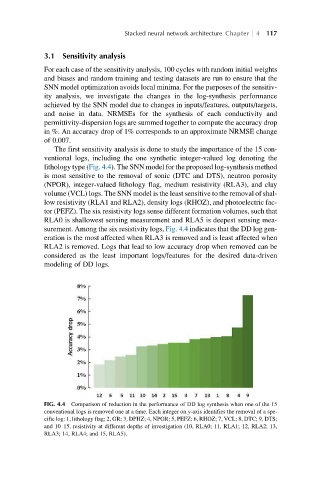
The first sensitivity analysis is done to study the importance of the 15 con-
ventional logs, including the one synthetic integer-valued log denoting the
lithology type (Fig. 4.4). The SNN model for the proposed log-synthesis method
is most sensitive to the removal of sonic (DTC and DTS), neutron porosity
(NPOR), integer-valued lithology flag, medium resistivity (RLA3), and clay
volume (VCL) logs. The SNN model is the least sensitive to the removal of shal-
low resistivity (RLA1 and RLA2), density logs (RHOZ), and photoelectric fac-
tor (PEFZ). The six resistivity logs sense different formation volumes, such that
RLA0 is shallowest sensing measurement and RLA5 is deepest sensing mea-
surement. Among the six resistivity logs, Fig. 4.4 indicates that the DD log gen-
eration is the most affected when RLA3 is removed and is least affected when
RLA2 is removed. Logs that lead to low accuracy drop when removed can be
considered as the least important logs/features for the desired data-driven
modeling of DD logs.
FIG. 4.4 Comparison of reduction in the performance of DD log synthesis when one of the 15
conventional logs is removed one at a time. Each integer on y-axis identifies the removal of a spe-
cific log: 1, lithology flag; 2, GR; 3, DPHZ; 4, NPOR; 5, PEFZ; 6, RHOZ; 7, VCL; 8, DTC; 9, DTS;
and 10–15, resistivity at different depths of investigation (10, RLA0; 11, RLA1; 12, RLA2; 13,
RLA3; 14, RLA4; and 15, RLA5).