
Page 140 - Machine Learning for Subsurface Characterization
P. 140
116 Machine learning for subsurface characterization
15
å r,f3
5
20
å r,f2
5
30
å r,f1
0
50
å r,f0
0
s f3 (mS/m) 500 0
s f2 (mS/m) 500 0
s f1 (mS/m) 500 0
s f0 (mS/m) 500 0 0 50
100
Depth 150 200 250 300
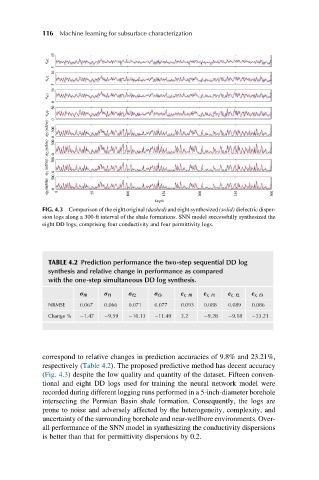
FIG. 4.3 Comparison of the eight original (dashed) and eight synthesized (solid) dielectric disper-
sion logs along a 300-ft interval of the shale formations. SNN model successfully synthesized the
eight DD logs, comprising four conductivity and four permittivity logs.
TABLE 4.2 Prediction performance the two-step sequential DD log
synthesis and relative change in performance as compared
with the one-step simultaneous DD log synthesis.
σ f0 σ f1 σ f2 σ f3 ε r, f0 ε r, f1 ε r, f2 ε r, f3
NRMSE 0.067 0.066 0.071 0.077 0.093 0.088 0.089 0.086
Change % 1.47 9.59 10.13 11.49 2.2 9.28 9.18 23.21
correspond to relative changes in prediction accuracies of 9.8% and 23.21%,
respectively (Table 4.2). The proposed predictive method has decent accuracy
(Fig. 4.3) despite the low quality and quantity of the dataset. Fifteen conven-
tional and eight DD logs used for training the neural network model were
recorded during different logging runs performed in a 5-inch-diameter borehole
intersecting the Permian Basin shale formation. Consequently, the logs are
prone to noise and adversely affected by the heterogeneity, complexity, and
uncertainty of the surrounding borehole and near-wellbore environments. Over-
all performance of the SNN model in synthesizing the conductivity dispersions
is better than that for permittivity dispersions by 0.2.