
Page 139 - Machine Learning for Subsurface Characterization
P. 139
Stacked neural network architecture Chapter 4 115
for 100 times with different initial weights and biases and different training and
testing datasets to avoid local minima during the model optimization. The best
model is then selected from among the 100 models.
3 Results
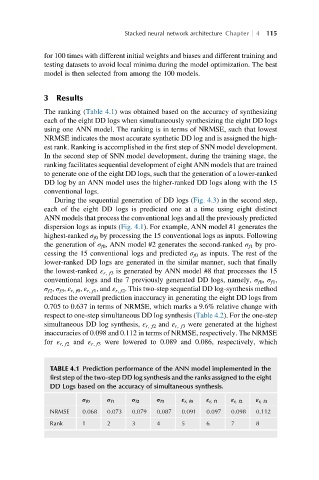
The ranking (Table 4.1) was obtained based on the accuracy of synthesizing
each of the eight DD logs when simultaneously synthesizing the eight DD logs
using one ANN model. The ranking is in terms of NRMSE, such that lowest
NRMSE indicates the most accurate synthetic DD log and is assigned the high-
est rank. Ranking is accomplished in the first step of SNN model development.
In the second step of SNN model development, during the training stage, the
ranking facilitates sequential development of eight ANN models that are trained
to generate one of the eight DD logs, such that the generation of a lower-ranked
DD log by an ANN model uses the higher-ranked DD logs along with the 15
conventional logs.
During the sequential generation of DD logs (Fig. 4.3) in the second step,
each of the eight DD logs is predicted one at a time using eight distinct
ANN models that process the conventional logs and all the previously predicted
dispersion logs as inputs (Fig. 4.1). For example, ANN model #1 generates the
highest-ranked σ f0 by processing the 15 conventional logs as inputs. Following
the generation of σ f0 , ANN model #2 generates the second-ranked σ f1 by pro-
cessing the 15 conventional logs and predicted σ f0 as inputs. The rest of the
lower-ranked DD logs are generated in the similar manner, such that finally
the lowest-ranked ε r, f3 is generated by ANN model #8 that processes the 15
conventional logs and the 7 previously generated DD logs, namely, σ f0 , σ f1 ,
σ f2 , σ f3 , ε r, f0 , ε r, f1 , and ε r, f2 . This two-step sequential DD log-synthesis method
reduces the overall prediction inaccuracy in generating the eight DD logs from
0.705 to 0.637 in terms of NRMSE, which marks a 9.6% relative change with
respect to one-step simultaneous DD log synthesis (Table 4.2). For the one-step
simultaneous DD log synthesis, ε r, f2 and ε r, f3 were generated at the highest
inaccuracies of 0.098 and 0.112 in terms of NRMSE, respectively. The NRMSE
for ε r, f2 and ε r, f3 were lowered to 0.089 and 0.086, respectively, which
TABLE 4.1 Prediction performance of the ANN model implemented in the
first step of the two-step DD log synthesis and the ranks assigned to the eight
DD Logs based on the accuracy of simultaneous synthesis.
σ f0 σ f1 σ f2 σ f3 ε r, f0 ε r, f1 ε r, f2 ε r, f3
NRMSE 0.068 0.073 0.079 0.087 0.091 0.097 0.098 0.112
Rank 1 2 3 4 5 6 7 8