
Page 262 - Machine Learning for Subsurface Characterization
P. 262
226 Machine learning for subsurface characterization
point depending on the class that is the most common among the k-nearest
neighbors. kNNR predicts the target for a new data point as a weighted
average of the target values for the k-nearest neighbors to the new data
point. The weights are the inverse of the distance between the training data
points and the new data point for which the target value needs to be
predicted. kNNR does not build a model and does not need a training phase.
kNNR requires all the training data points to be available during the
deployment, which is a drawback of this method. kNNR synthesizes the log
by computing the weighted average of targets for the k-nearest training
points around the testing points.
3.6 Artificial neural network
Artificial neural network (ANN) is a collection of connected computational
units or nodes called neurons arranged in multiple computational layers.
Each neuron linearly combines its inputs and then passes it through an
activation function, which can be a linear or nonlinear filter. Linear
combination of inputs is performed by summing up the products of weights
and inputs. ANN generates the target through feed-forward data flow and
then updates the weights of each neuron by backpropagation of errors during
the training iterations. For purposes of NMR synthesis, we implement four-
layered ANN with two hidden layers. Each hidden layer has 200 neurons.
3.7 Comparisons of the test accuracy and computational
time of the shallow-learning models
The six models implemented are shallow-learning regression models. A grid
search was performed to find hyperparameters that optimize the models.
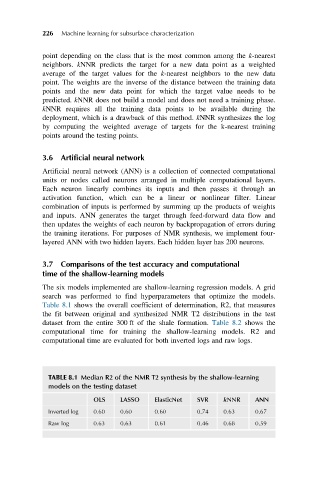
Table 8.1 shows the overall coefficient of determination, R2, that measures
the fit between original and synthesized NMR T2 distributions in the test
dataset from the entire 300 ft of the shale formation. Table 8.2 shows the
computational time for training the shallow-learning models. R2 and
computational time are evaluated for both inverted logs and raw logs.
TABLE 8.1 Median R2 of the NMR T2 synthesis by the shallow-learning
models on the testing dataset
OLS LASSO ElasticNet SVR kNNR ANN
Inverted log 0.60 0.60 0.60 0.74 0.63 0.67
Raw log 0.63 0.63 0.61 0.46 0.68 0.59